Skip to content
 Blueprint
Optimizing Seed Production with Blueprint
Revolutionizing Corteva’s Global Agriculture through Advanced Data Insights

Duration:
2019 – 2024
Product Overview
Blueprint is a web and mobile application where field selection, in-season field management, and post-season insights take place.
Blueprint enables seed production agronomy teams to evaluate crop health, fertility, soils, drainage, yield, and other geospatial data like never before. All of your data is in one place. Both during the growing season, or during the off-season.
Blueprint mobile standardizes the yield estimation process for the final in-field yield estimation by leveraging mobile ear photometry. This tool helps us be more accurate in the short term and the data will help in the journey to build predictive yield models for the future. It also helps with the data flow to Seed Pro.
By amalgamating diverse data sources, Blueprint facilitates a holistic approach to field analysis, enabling farmers to optimize seed yields and make informed decisions for a more efficient and sustainable agricultural future.
My Role
As the Lead UX Designer, I played a pivotal role in guiding Blueprint from its conceptualization to the realization of its third version. My responsibilities ranged from initial planning and requirements gathering to strategic decision-making, wireframing, content management, and overseeing the project through multiple iterations from MVP to V3. Additionally, I took on some Delivery Lead responsibilities during team turnover, ensuring seamless project continuity.
Tools
- Sketch
- Figma
- Azure Dev Ops
- Microsoft 365 Suite
- Mural
- Google Analytics
- Air Table
- Maze
Problem Statement
How might we optimize Blueprint to not only streamline the integration of diverse agricultural data sources but also enhance the platform’s analytical capabilities, fostering deeper insights and actionable recommendations for agronomists?
Goals
The central goal of Blueprint is to significantly improve seed yields for farmers while fostering stronger customer relationships by leveraging innovative technology to streamline and replace time-consuming practices in the agronomy field. By integrating new technologies, Blueprint aims to empower agronomists with a comprehensive tool that expedites field analysis, allowing for quicker and more informed decision-making. This, in turn, contributes to increased seed yields, optimizing the efficiency of agricultural practices.
Design Process
The UX process for Blueprint was a dynamic interplay of interviews, process mapping, iterative design, and user feedback sessions. Through insightful user interviews, we honed in on agronomists’ needs, crafting detailed process maps to inform our design. Iterative cycles allowed us to adapt to evolving requirements, refining the user interface. Continuous user feedback sessions ensured Blueprint not only met, but exceeded expectations, resulting in a streamlined tool that redefines the user experience in agronomy technology.
Discover
- User Research
- User Interview
- Competitve Analysis
Define
- User Personas
- Empathy Map
- User Journey
Ideate
- User Flow
- Information Architecture
Design
- Wireframe
- Hi-Fi Designs
- Prototype

Test
- Feedbacks
- Conclusion
- Future Concept
Target Audience
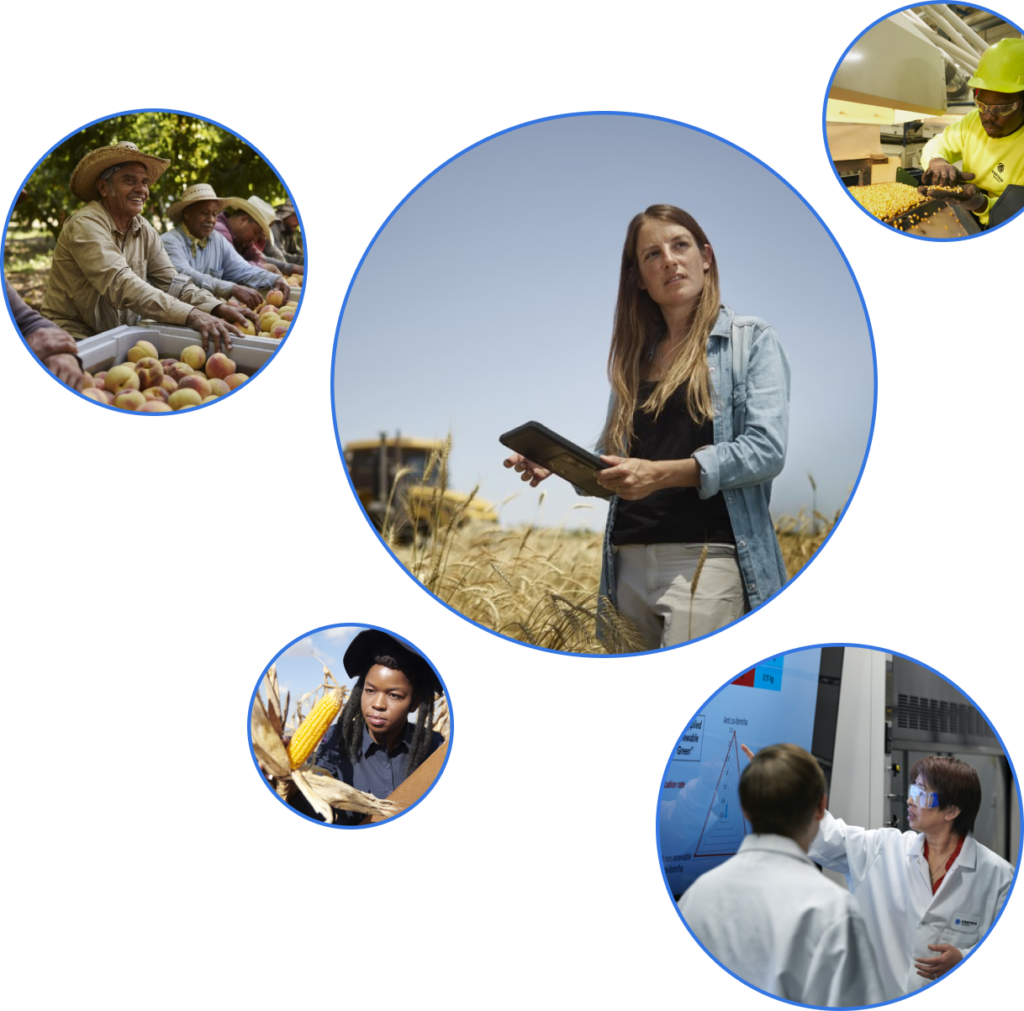
The primary audience for Blueprint includes agronomists, growers, 3rd party contractors, and data scientists. Whether you’re an agronomist striving for precision, a grower optimizing yields, a contractor contributing to the agricultural ecosystem, or a data scientist seeking valuable insights, Blueprint is designed to empower and streamline your experience in the world of agronomy.
User Research
Research was conduct throughout every design cycle, from short term research one sprint ahead of the teams, to long term research programs a full quarter ahead of the teams. Research methods varied depending on the project needs but always included interviews, feedback sessions, and subject matter reviews.
Analytic software was a implemented on every facet of the project to monitor user interaction so that we could not only better understand our users behaviors, but to also give them the right resources at their moment of need.
The Challenge
Corteva faced the challenge of efficiently utilizing diverse data streams and inputs for seed production optimization.
The need was to develop a tool that not only aggregated this information but also presented it in a way that agronomists and growers could interpret and leverage effectively.
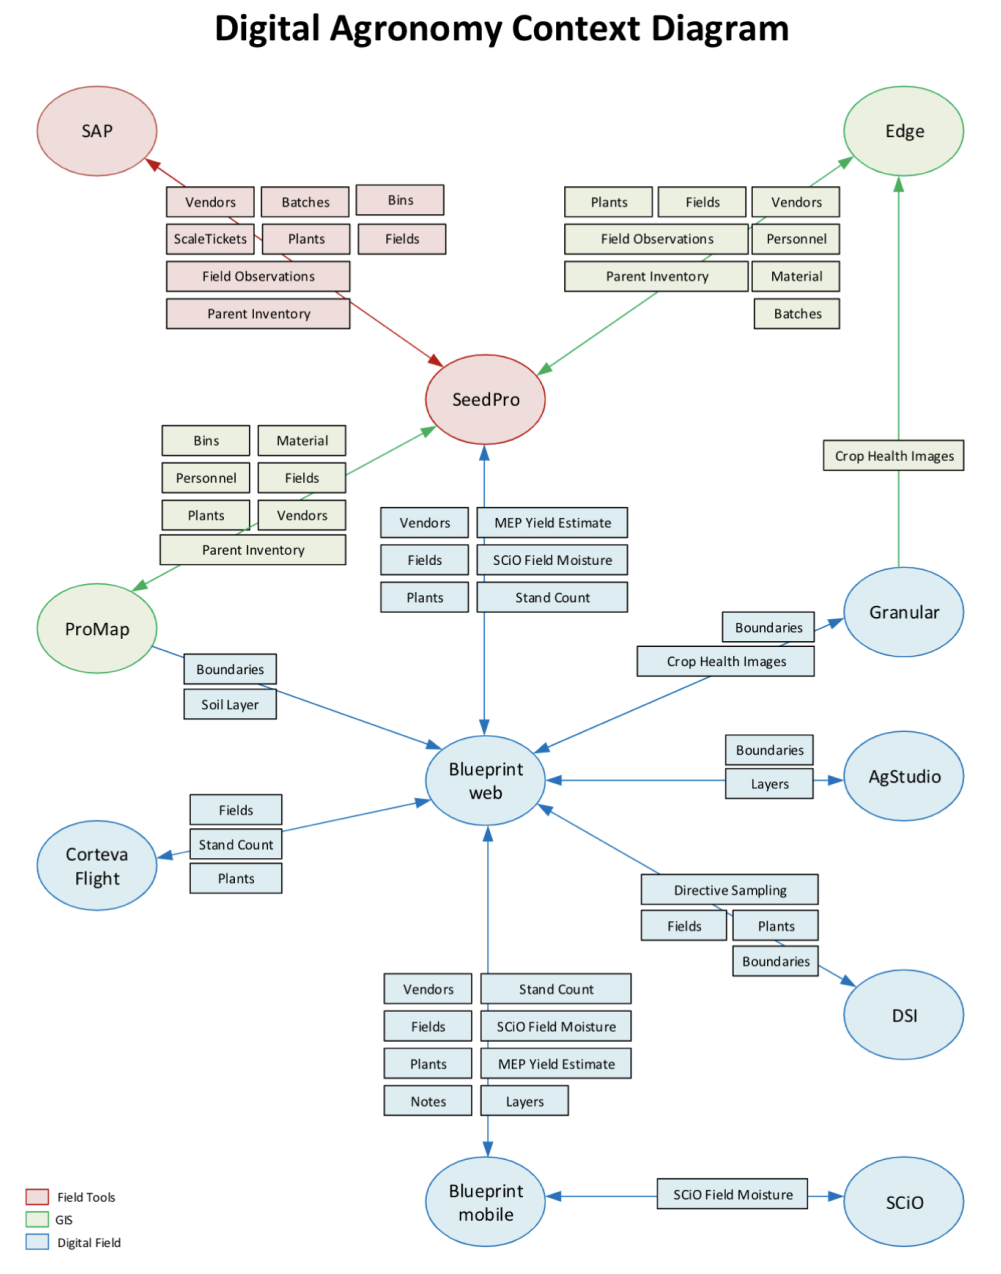
Furthermore, the tool had to seamlessly integrate with existing applications in the Corteva ecosystem, ensuring a smooth and cohesive data flow throughout the production cycle.
Striking a balance between complexity and user-friendly design was at the core of this UX design challenge.
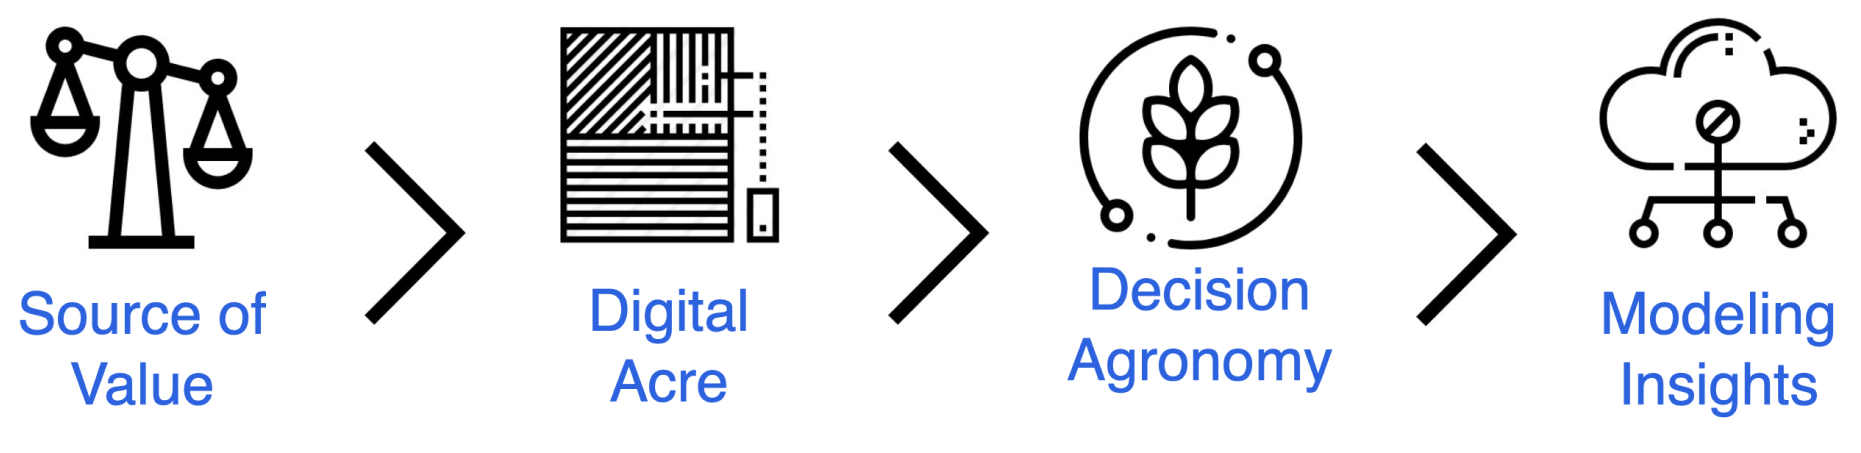
The Vision – Digital Agronomy
Relentless innovation.
Striving to produce the best products on the market.
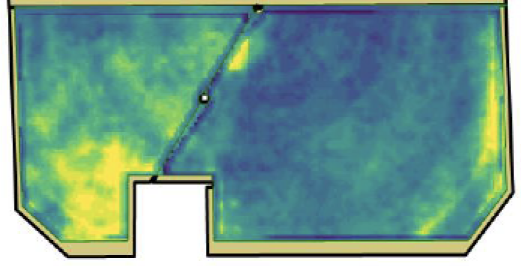
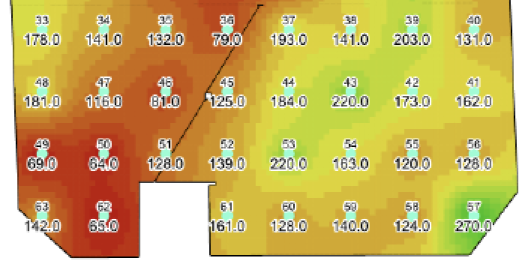
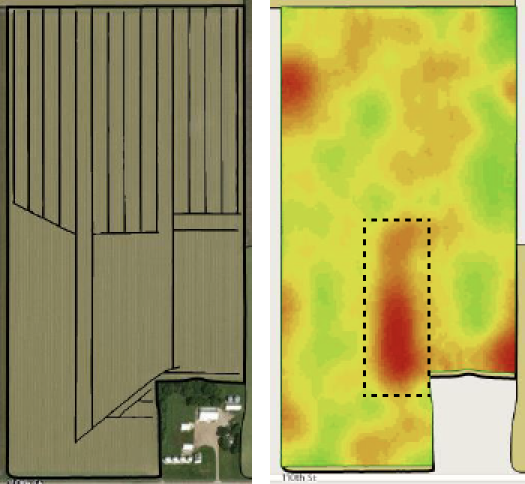
Visualizing fields variable
Moving from correlation to causation yield factors
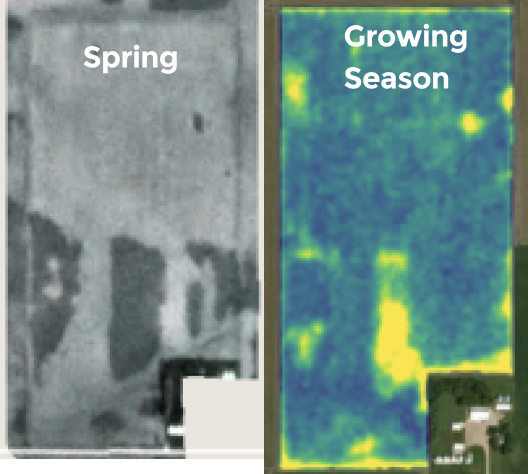
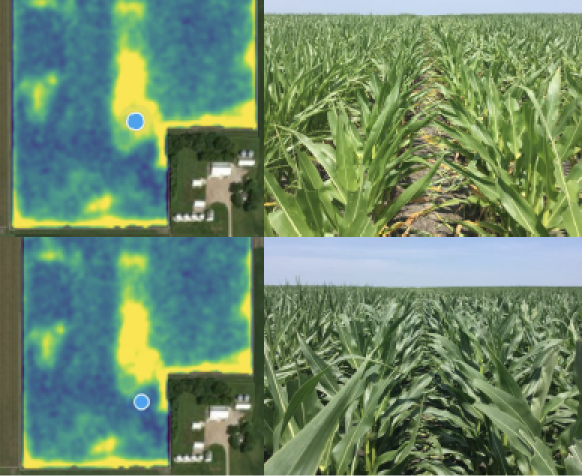
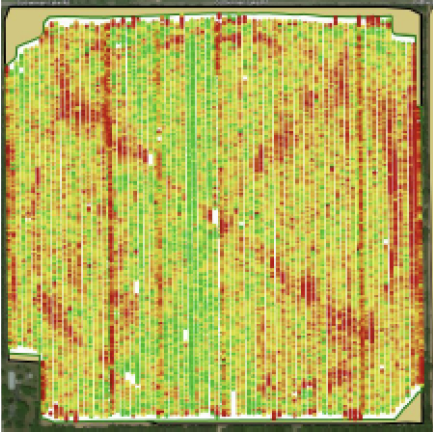
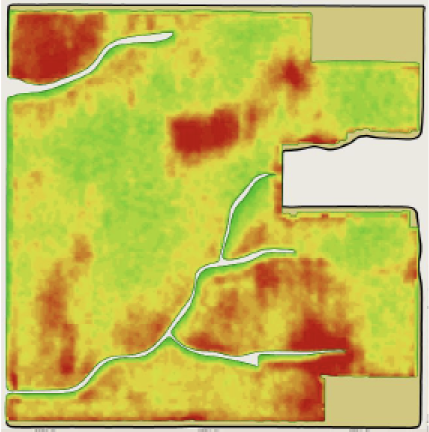
Crop Health Imagery
Fertility
Yield
Bringing it all together
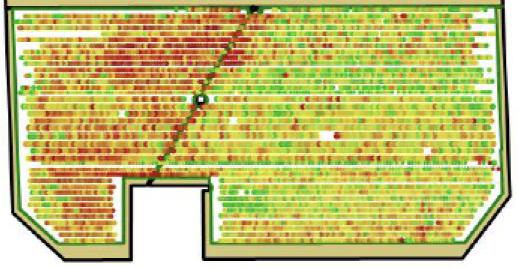
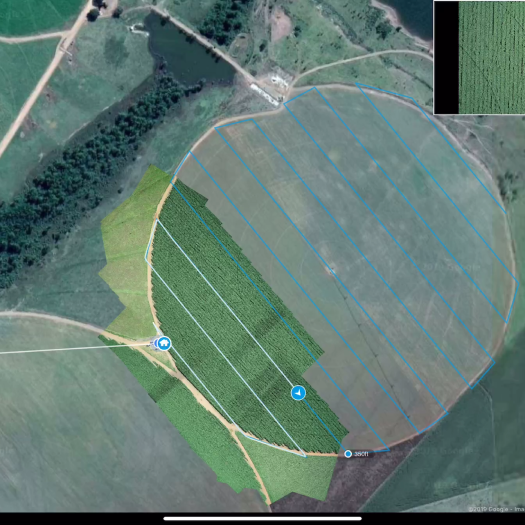
Satellite Imagery
Directive Scouting
Tile Yield
Driving Real World Change and
Better Land Management
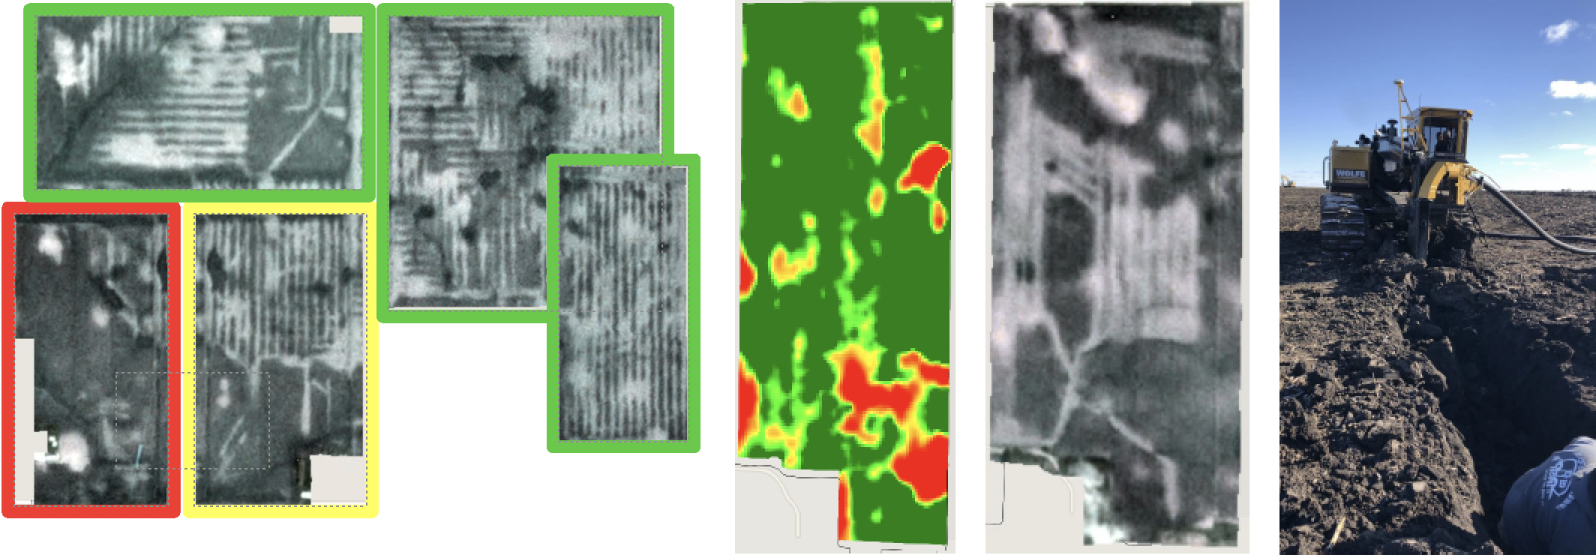
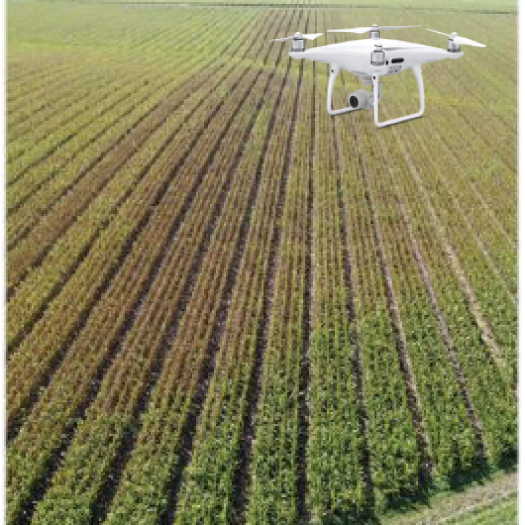
The largest drone fleet in North America
Enabling agronomists with UAV’s across the global production network
Stand Establishment
Drone Photography
Live Mapping
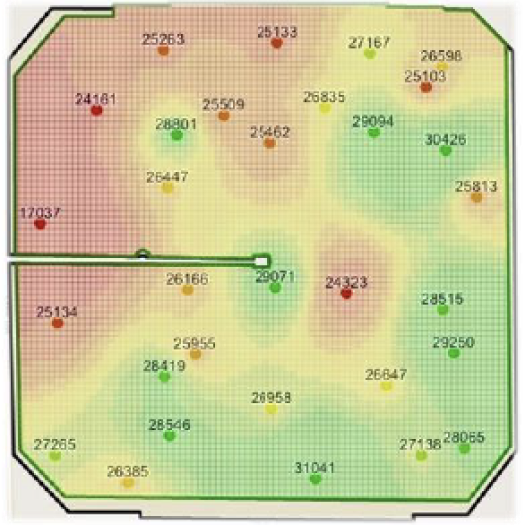
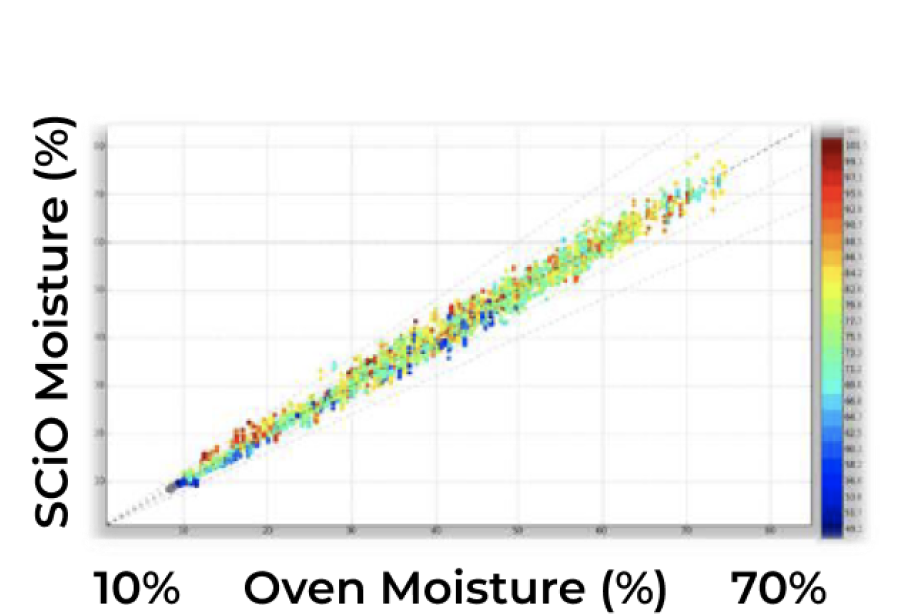
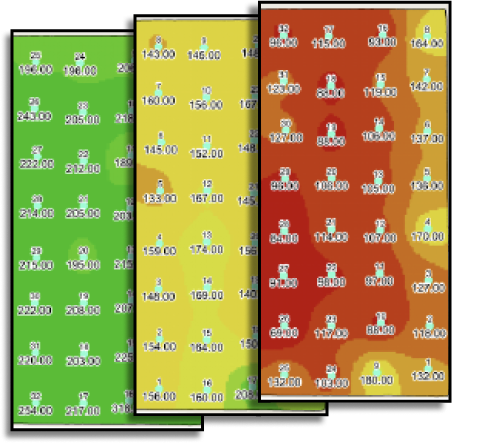
Next generation moisture estimation
Real-time, in-the-field moisture estimates with SCiO
Cloud Processing
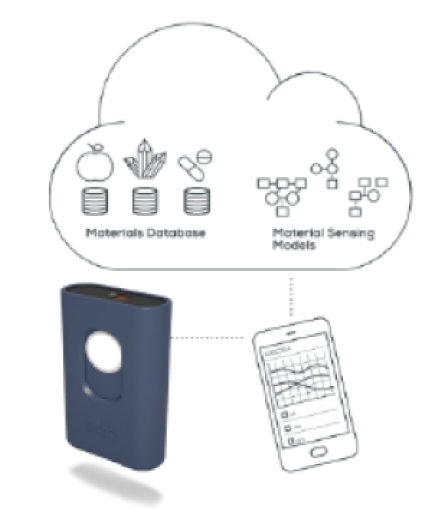
Visualized Moisture
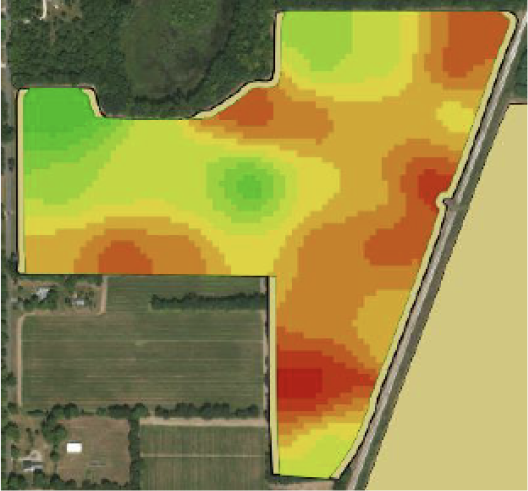
Yield Mapping
Enabling agronomists with UAV’s across the global production network
Seeding Rates
Yield Estimate
Soil Fertility

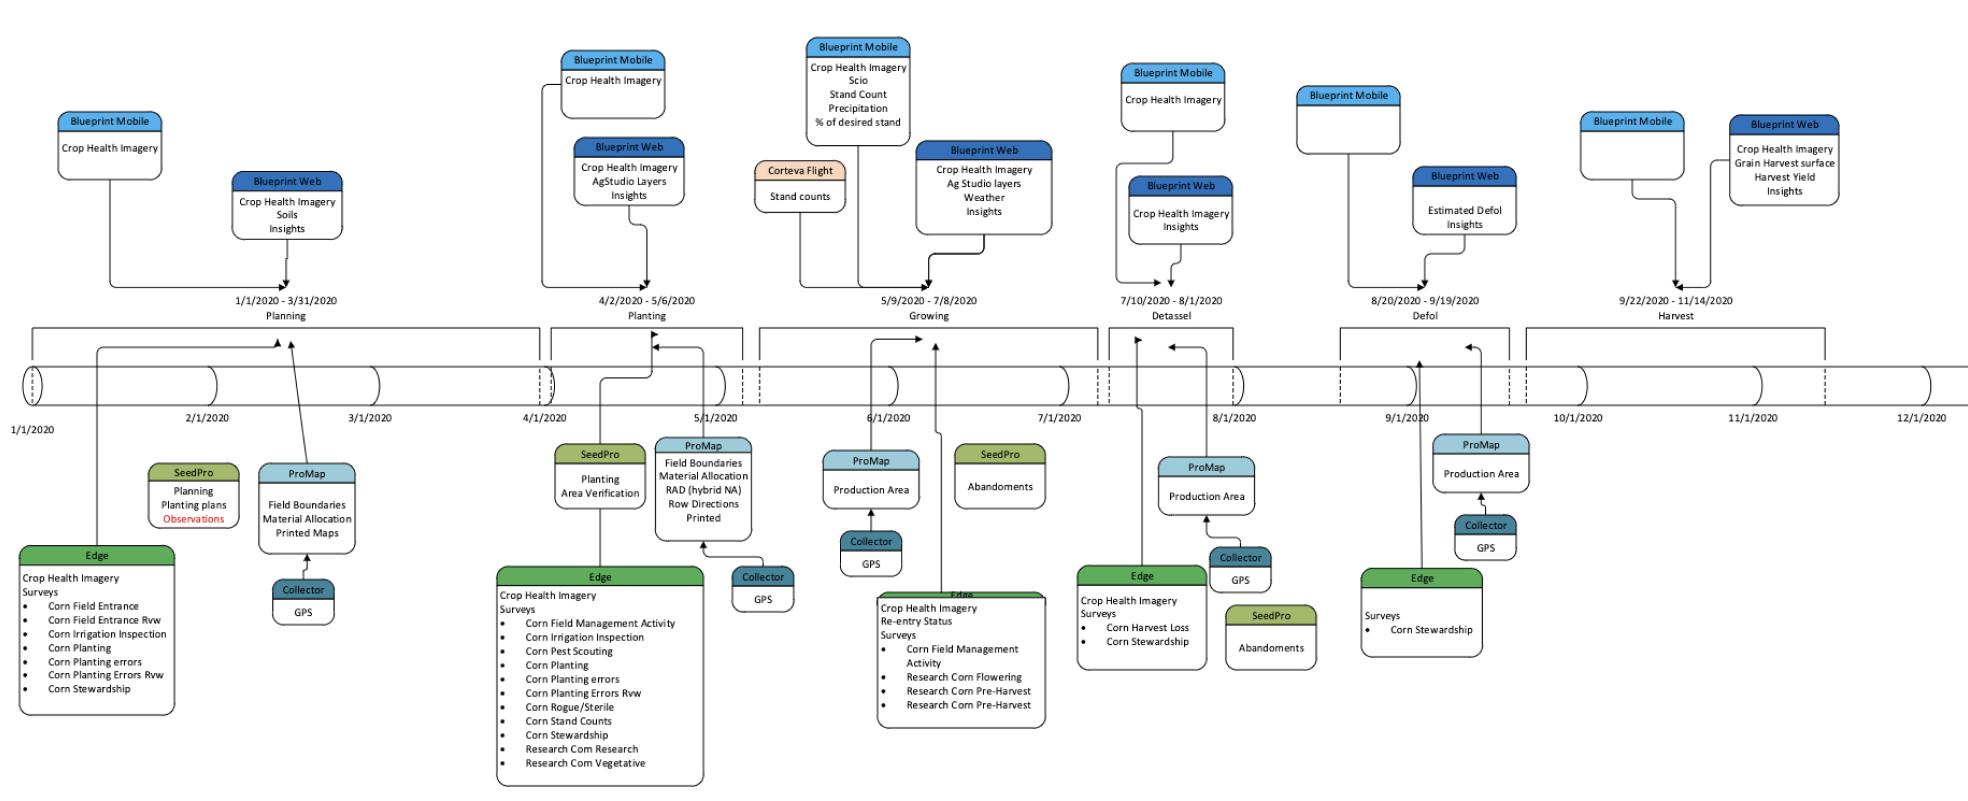
User Journey Map
The typical user journey of our internal agronomy users covers a vast expanse of tools and touch points that mirrors the cyclical nature of agronomy itself. While each feature of a tool inside Blueprint may have a compact user journey that matches a more standardized mapping system, to get the full context of how the Blueprint users move through the app as a whole, it is important to understand their journey throughout the growing season. This cohesive approach, which accounts for all apps used in conjunction during specific timeframes in Corteva’s app ecosystem helped provide context for the right information, at the right.
Measuring Success
The platform’s success, indicative of its early growth phase, is measured based on metrics collected from March 1, 2019, to December 29, 2021.
Throughout this period, the platform garnered an annual user base of 1,217, with 1,095 new users joining the platform. On a monthly basis, the platform consistently attracts 200-250 users, and on a weekly scale, it maintains an average of 80-100 users, showcasing a sustained and growing user community. These metric are from a global user base each with a 3 to 6 month growing season. Most of these users managed an average of 100,000 acres each.
The commitment to continuous improvement and innovation is evident in the development timeline, with 47 releases, 40 major feature releases, 5 UX enhancements, and 2 backend-only enhancements since 2020. These regular updates signify the project’s evolution and responsiveness to user needs.
Key features of the platform have demonstrated substantial usage, as reflected in the impressive 496,879 site views throughout 2021 alone. These metrics collectively highlight early success and growth, positioning the platform as a dynamic and impactful solution for agronomist.
It’s crucial to note that the project is still actively growing today, with ongoing updates and an expanding user base. The early success metrics serve as a testament to the platform’s journey, with continued growth and innovation shaping its future trajectory.
Note Worthy Metrics
New Users in one year: 1,095
This grew from less than 150 users from the app Blueprint replaced. That’s more than 50% of Corteva internal user base!
40 Major feature releases in 2 years
In the initial phases rapid delivery of features was key to gaining a strong user base.
Avg. Session Duration 00:11:50
The goal was to meet our users needs within 20 minutes or less.
Bounce Rate 7.59%
Ongoing research told us this success was due to keeping relevant information as easy to find as possible with a strong visual hierarchy.
Site views in 2021 496,879
This metric coupled with individual feature page views helped us understand our users needs throughout the growing season.
Avg Page views per year 20,000
At the time, the product was split into 6 different tools each with different uses cases and many useful features in each.
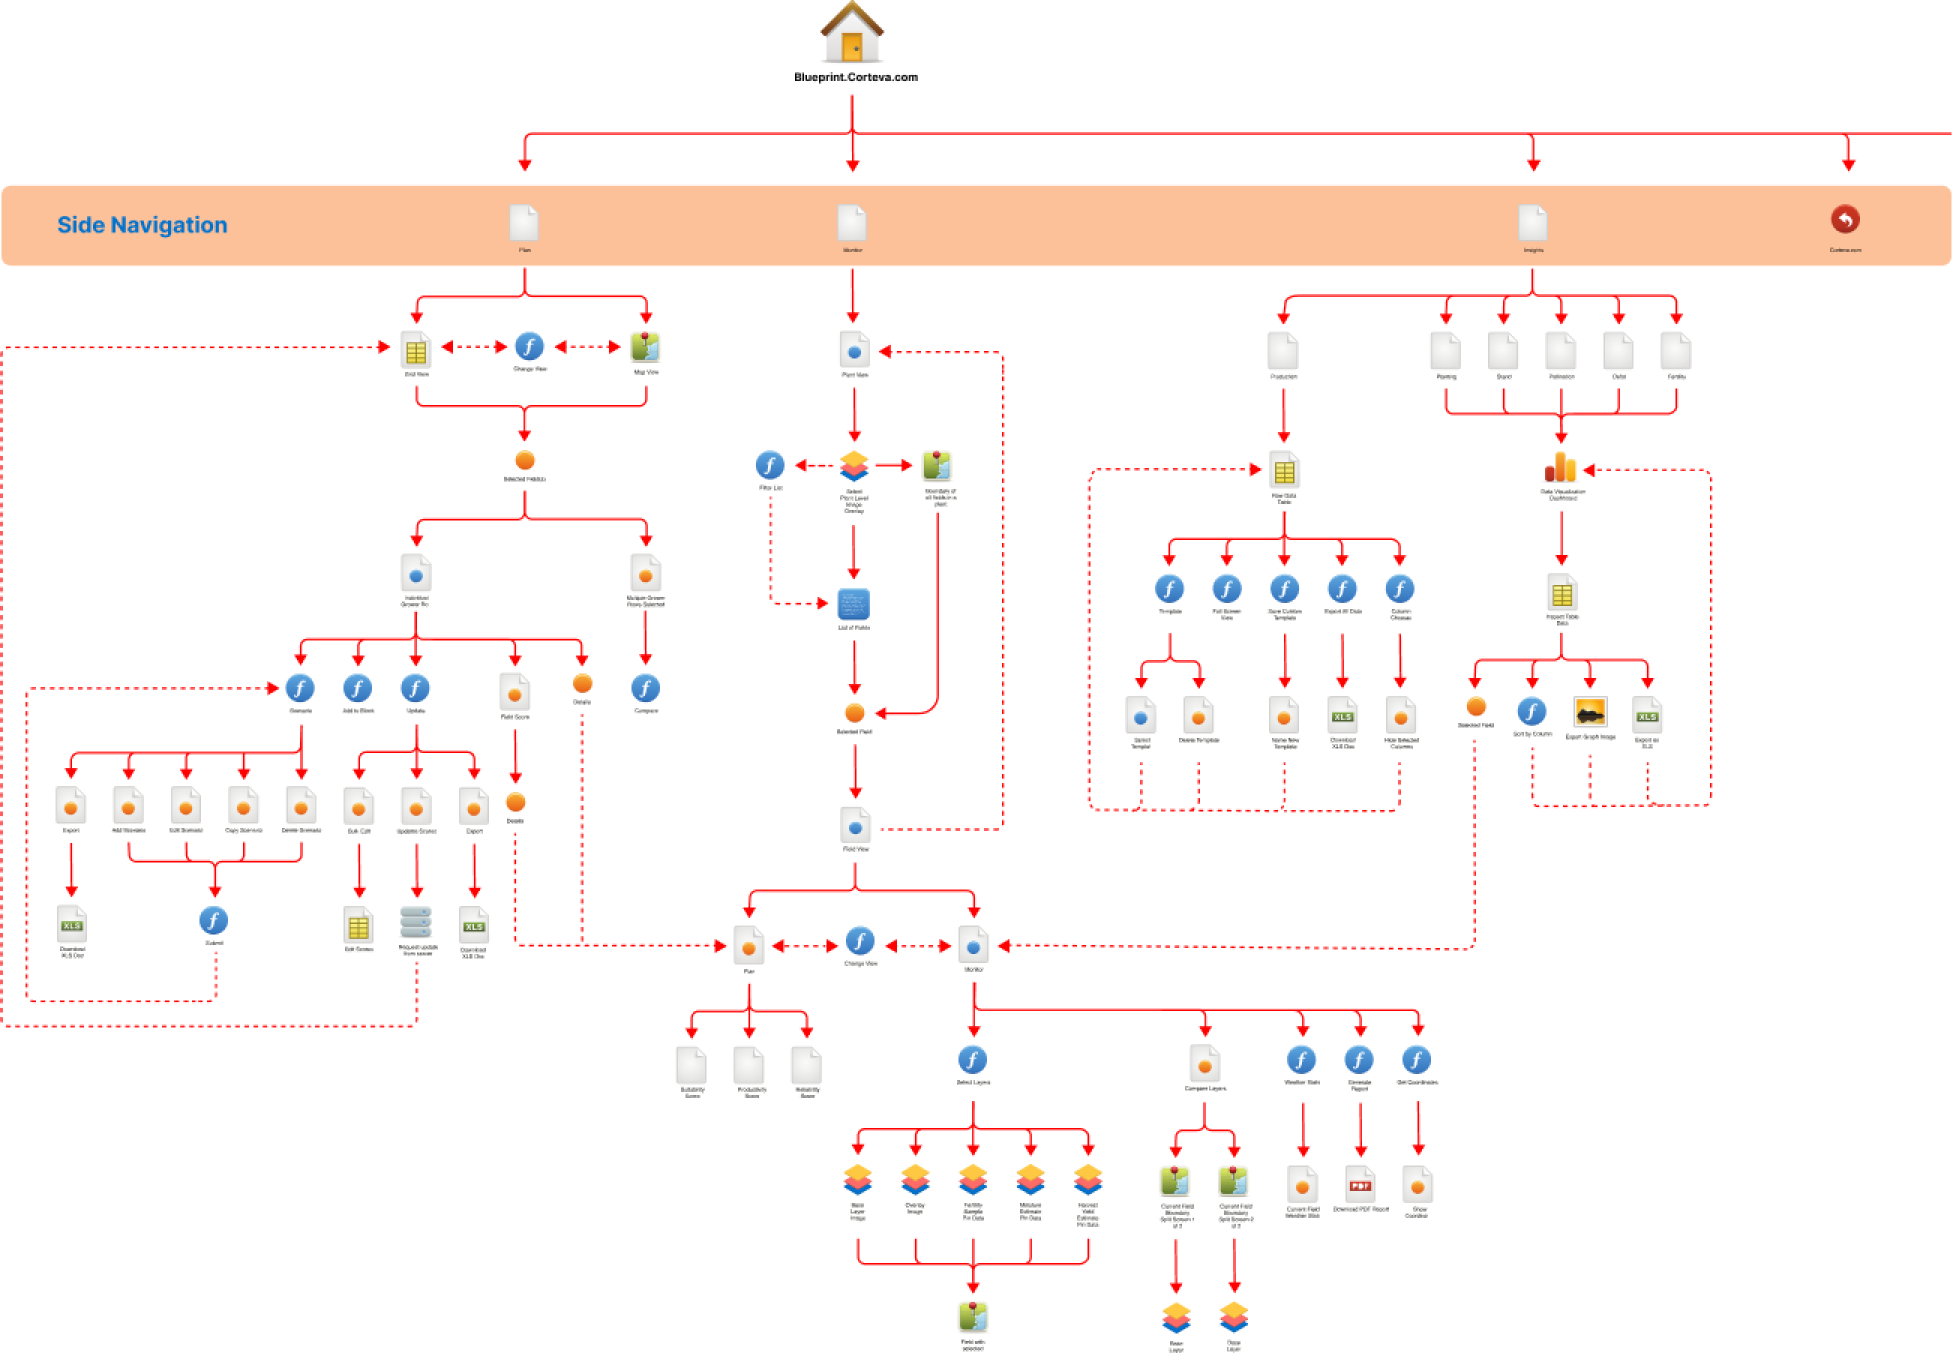
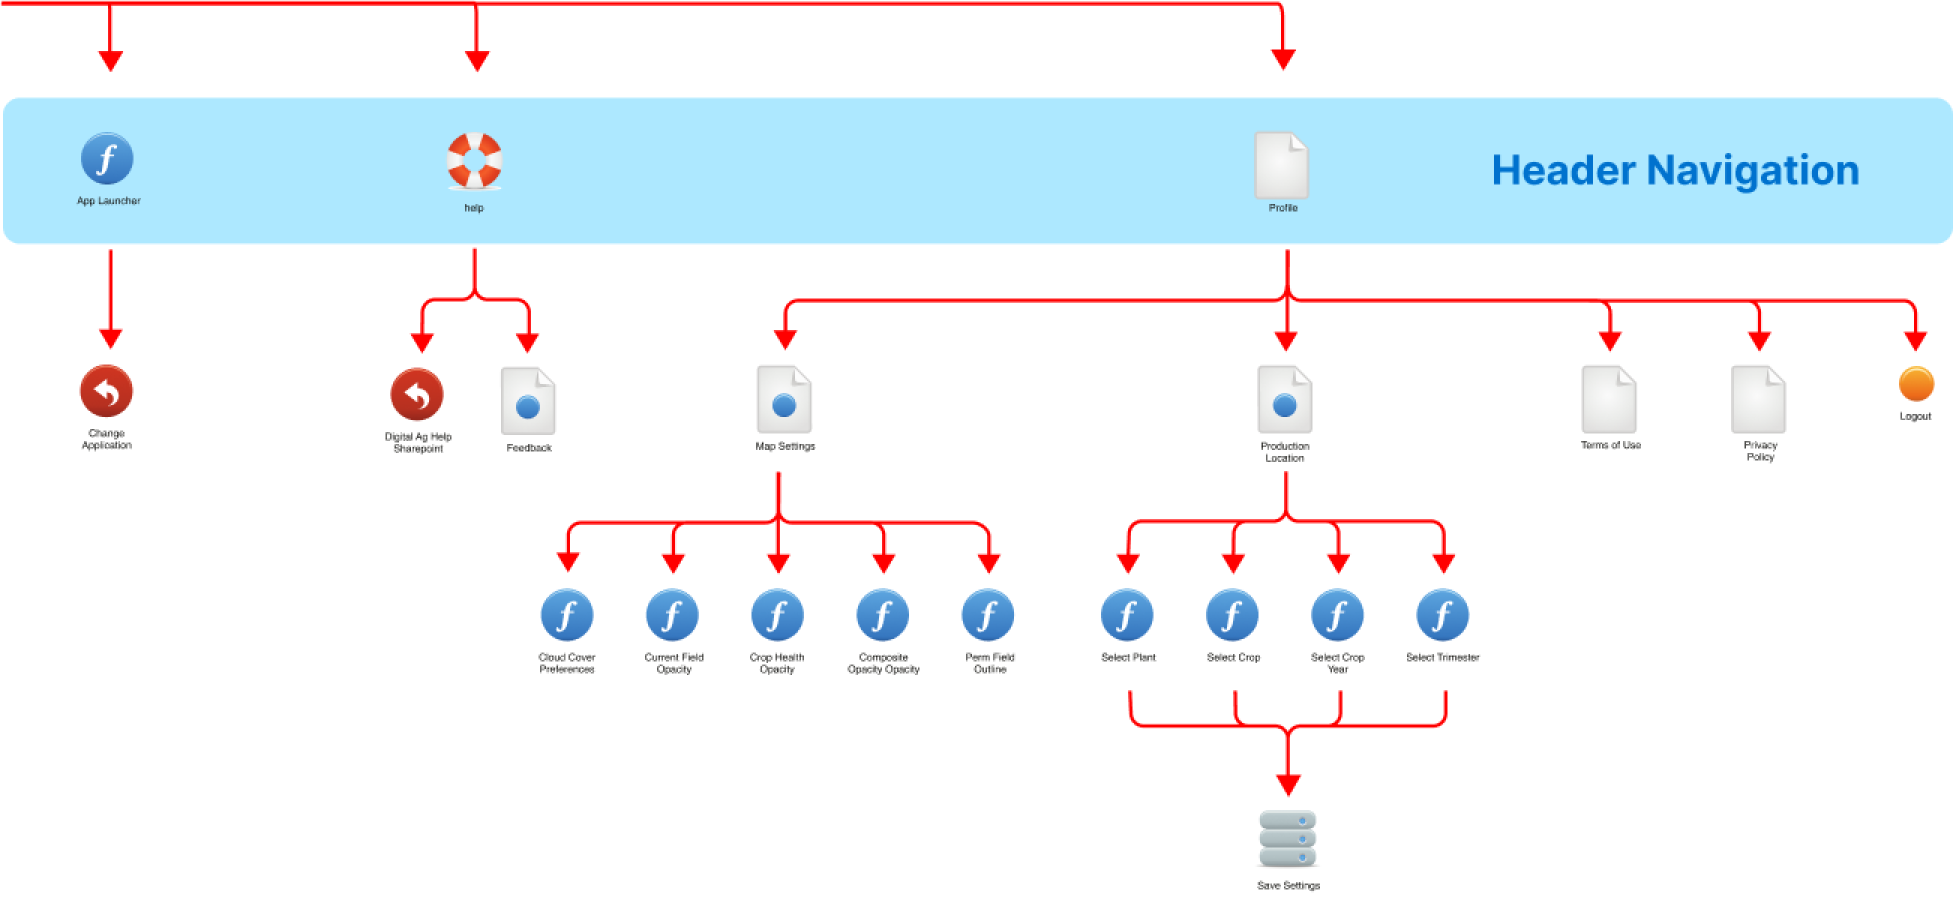
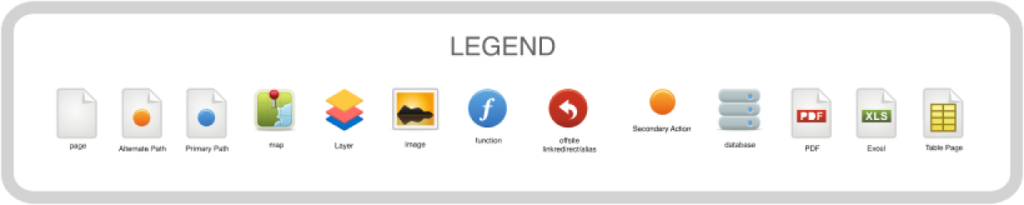
Information Architecture/User Flow
Unique Features
- Blueprint sets it’s self apart from other agronomy apps due to its impressive set of integrated features.
- A Competitive Analysis showed that no other app incorporates as many facets of the agronomy process.
- Even within Corteva's vast ecosystem of applications (spanning in the hundreds), no other single app exist that can visualize, analyze, and create data like Blueprint.
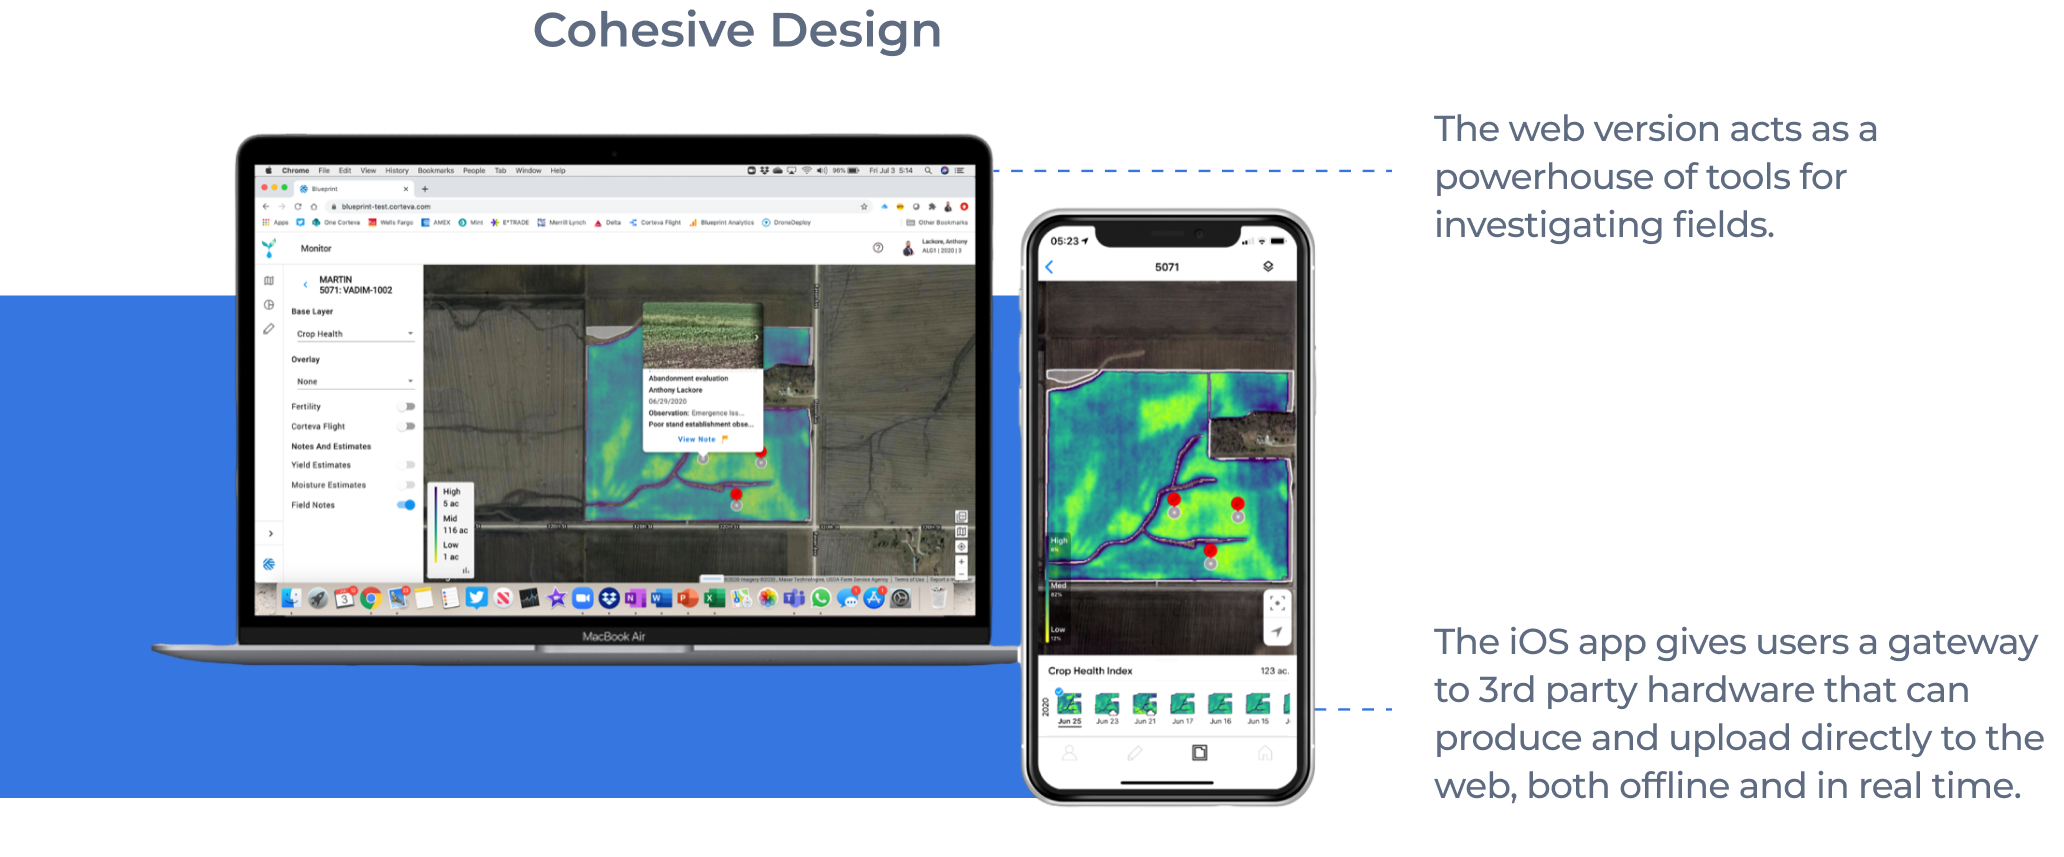
Paired Native iOS App
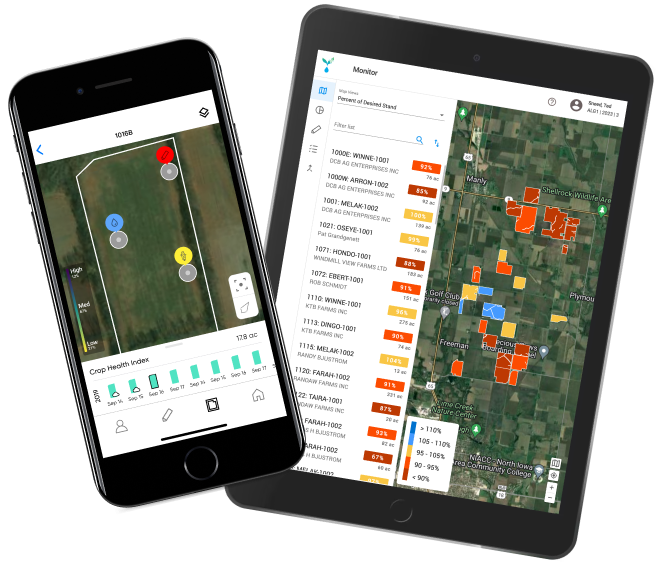
Blueprint Mobile is a paired platform of Blueprint Web. The iOS app offers additional features not available on the web app, such as data collection with SCiO, Ear Photometry, and writing Field Notes.

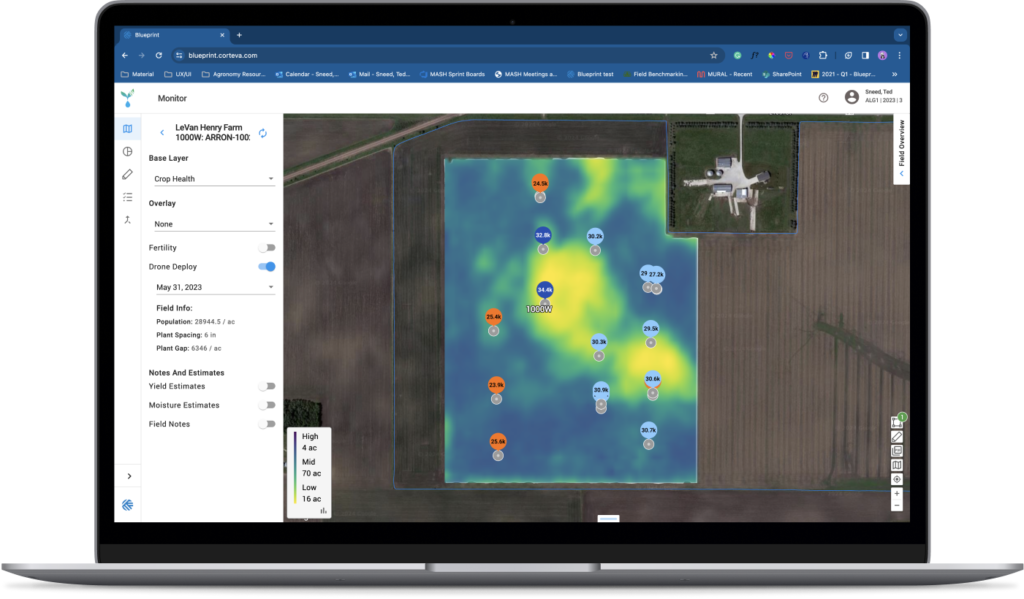
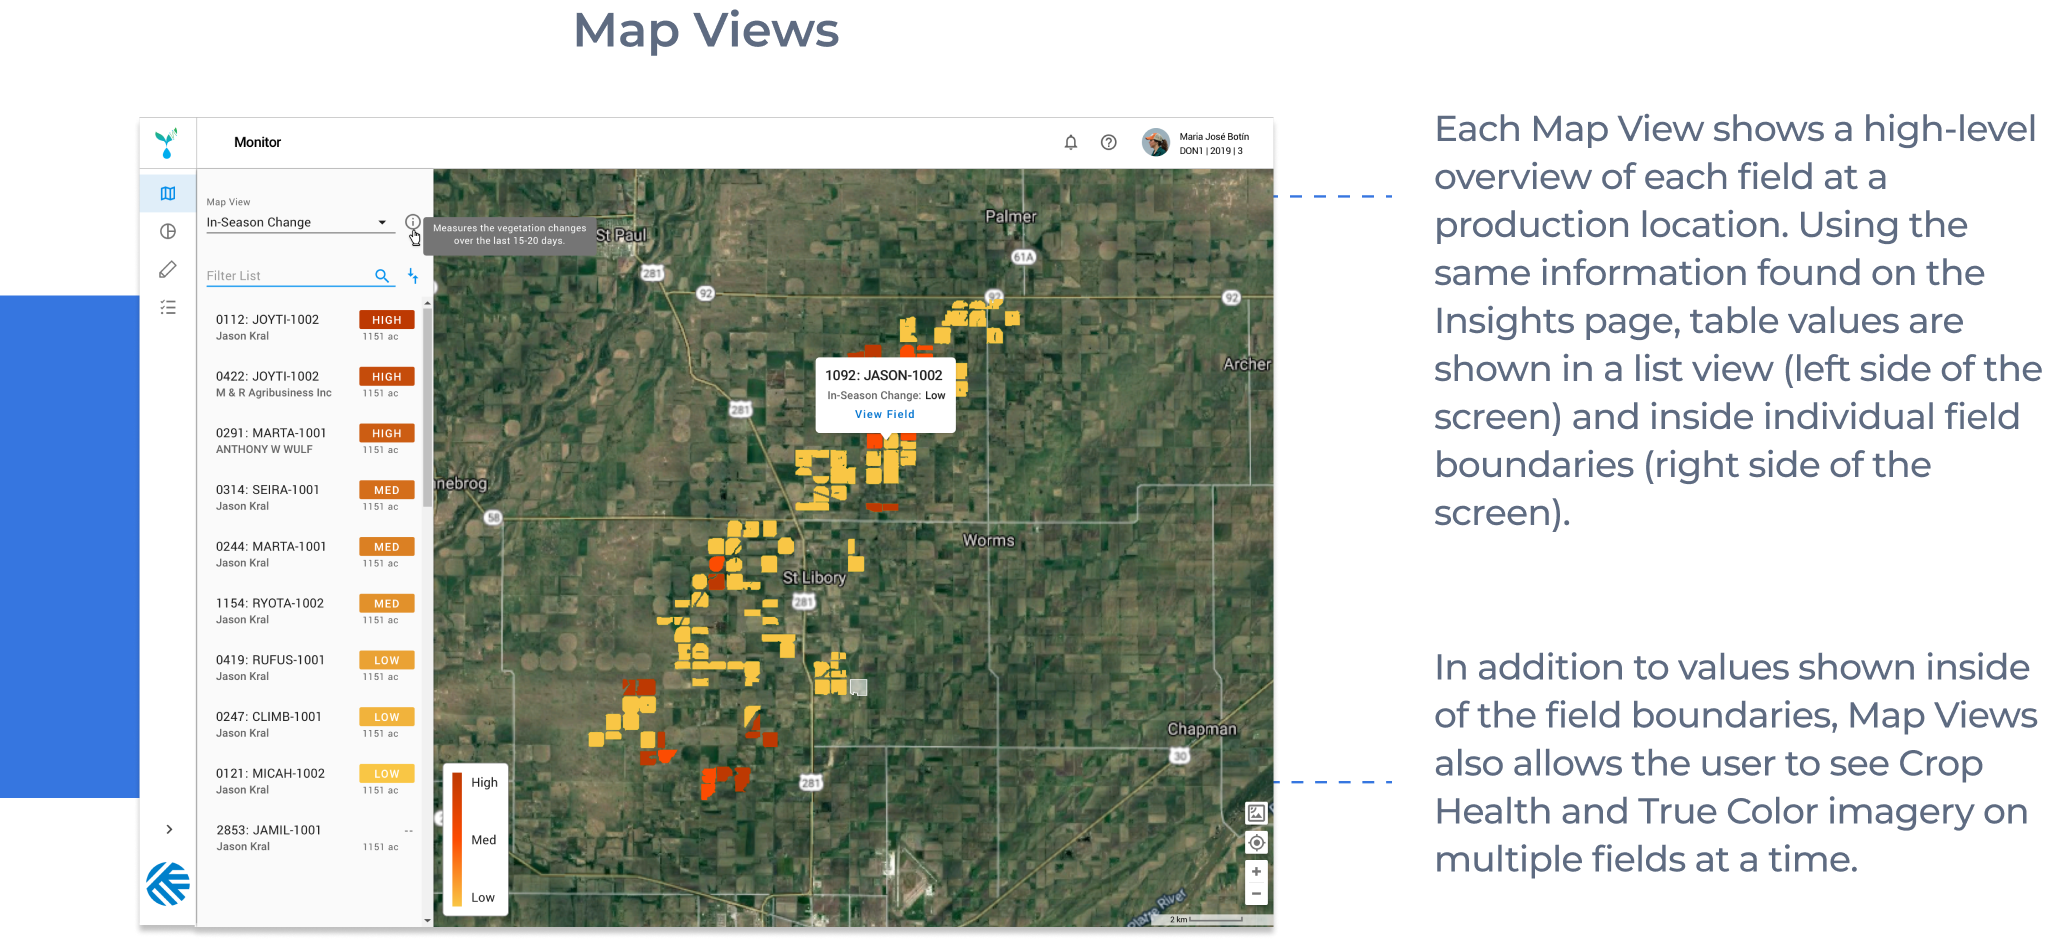
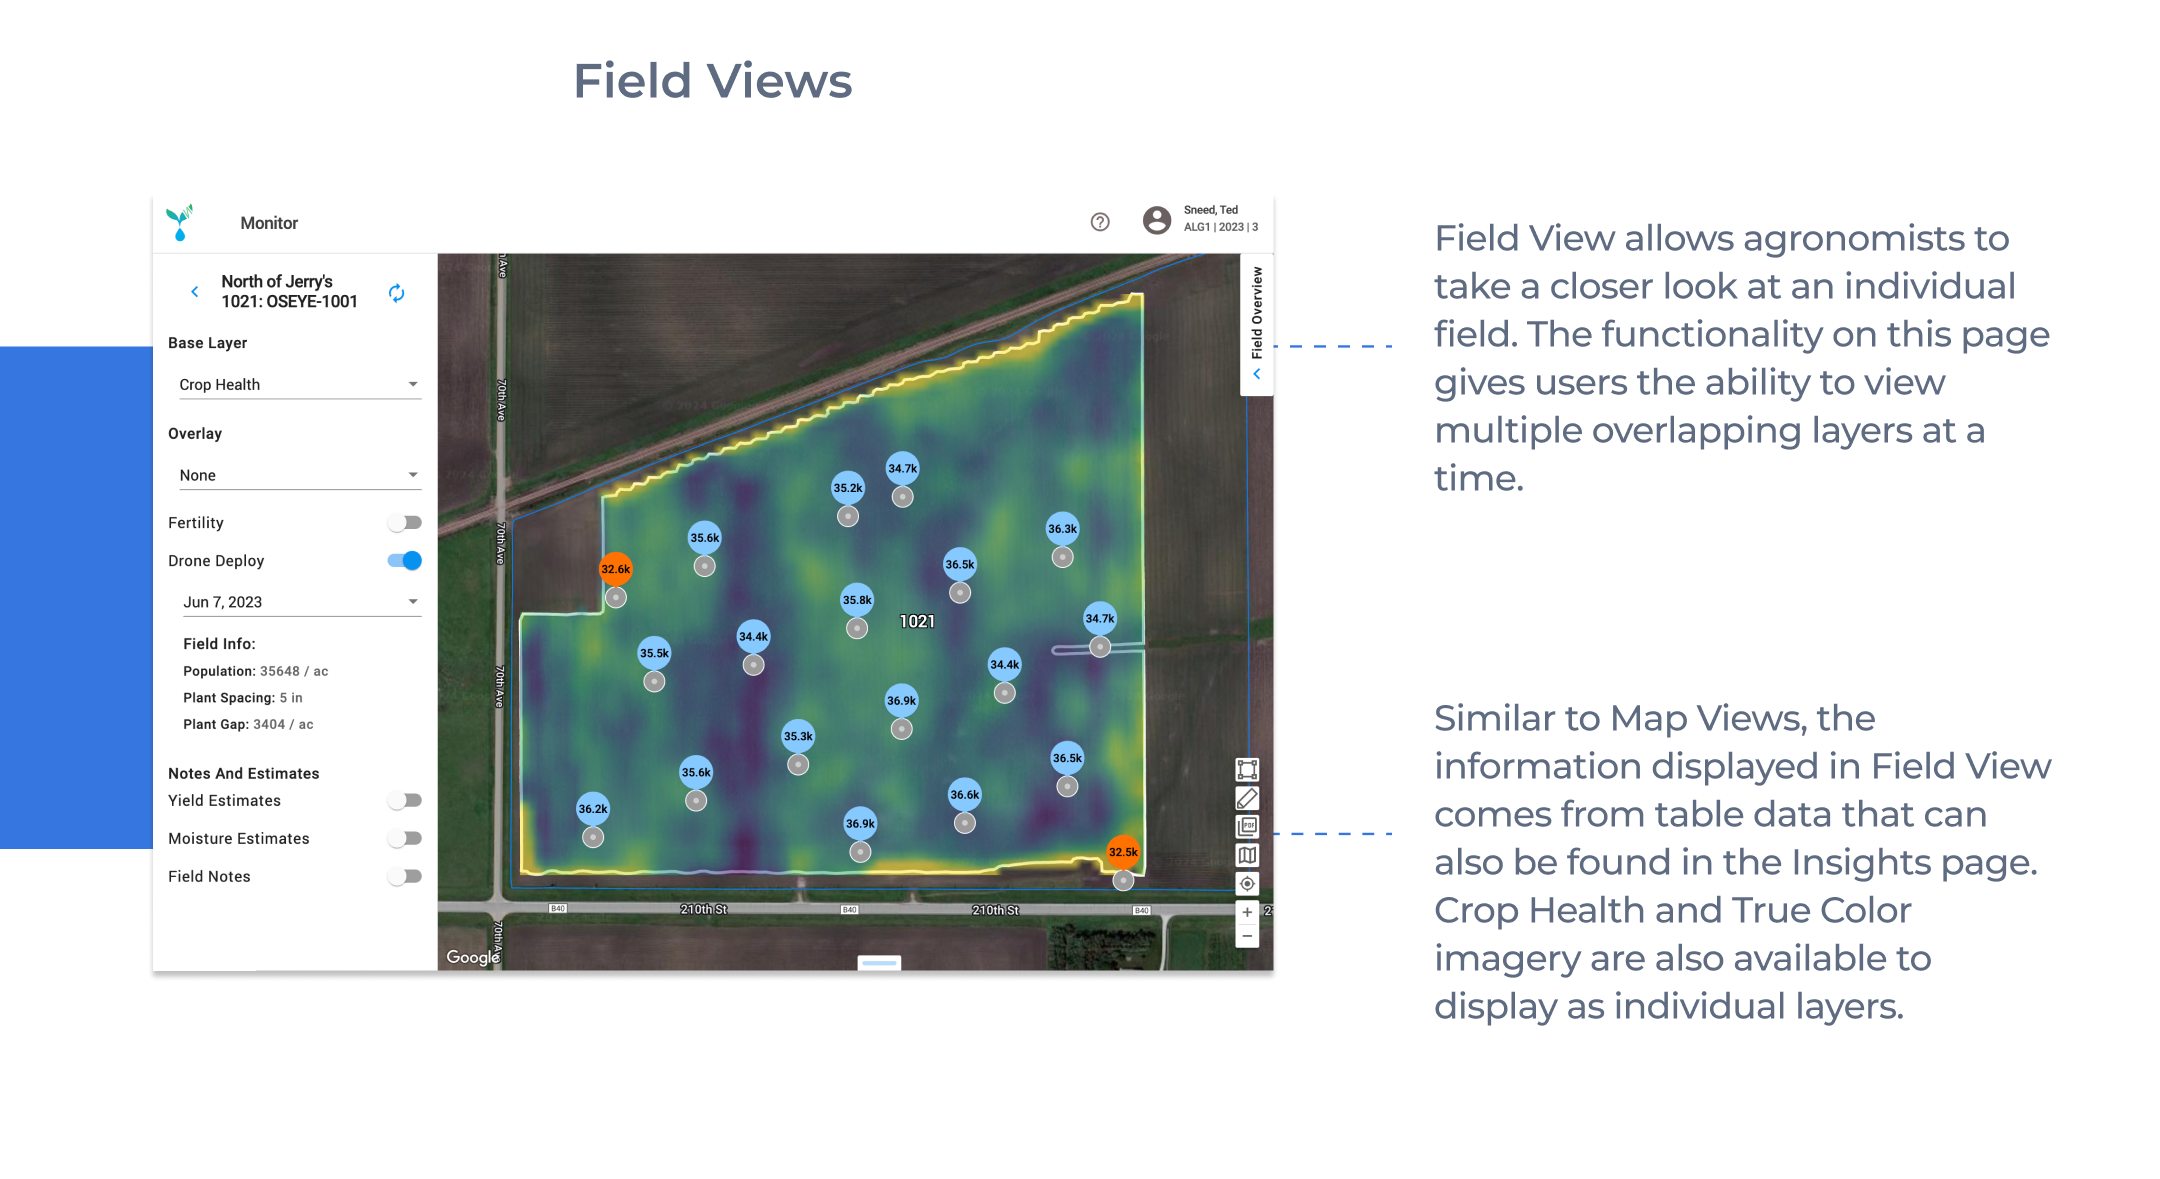
Monitor
Monitor is a map-based view that helps Agronomist visualize geospatial data from a variety of sources by displaying data with color-coded overlays and images.
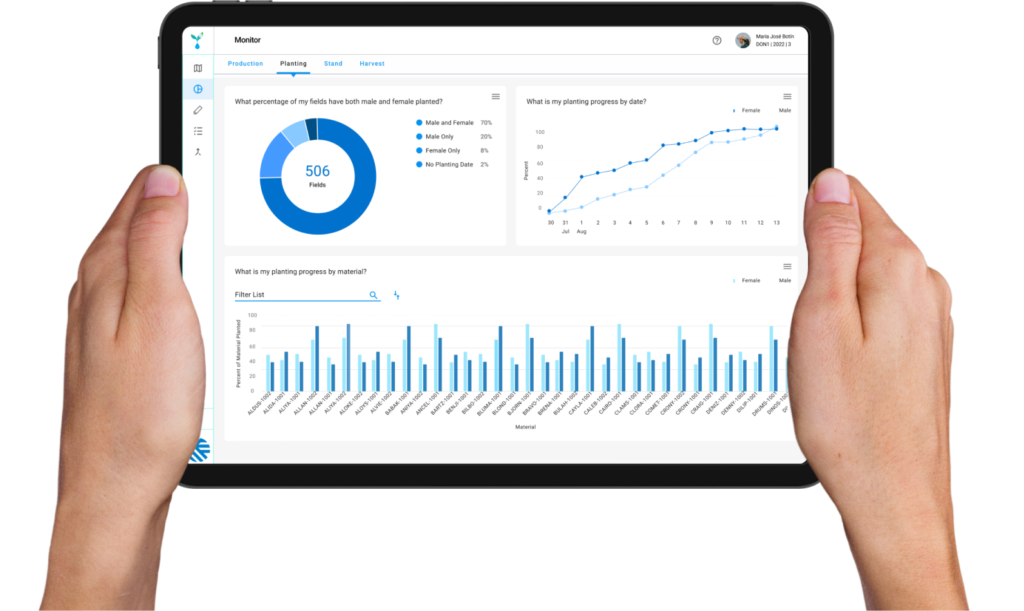
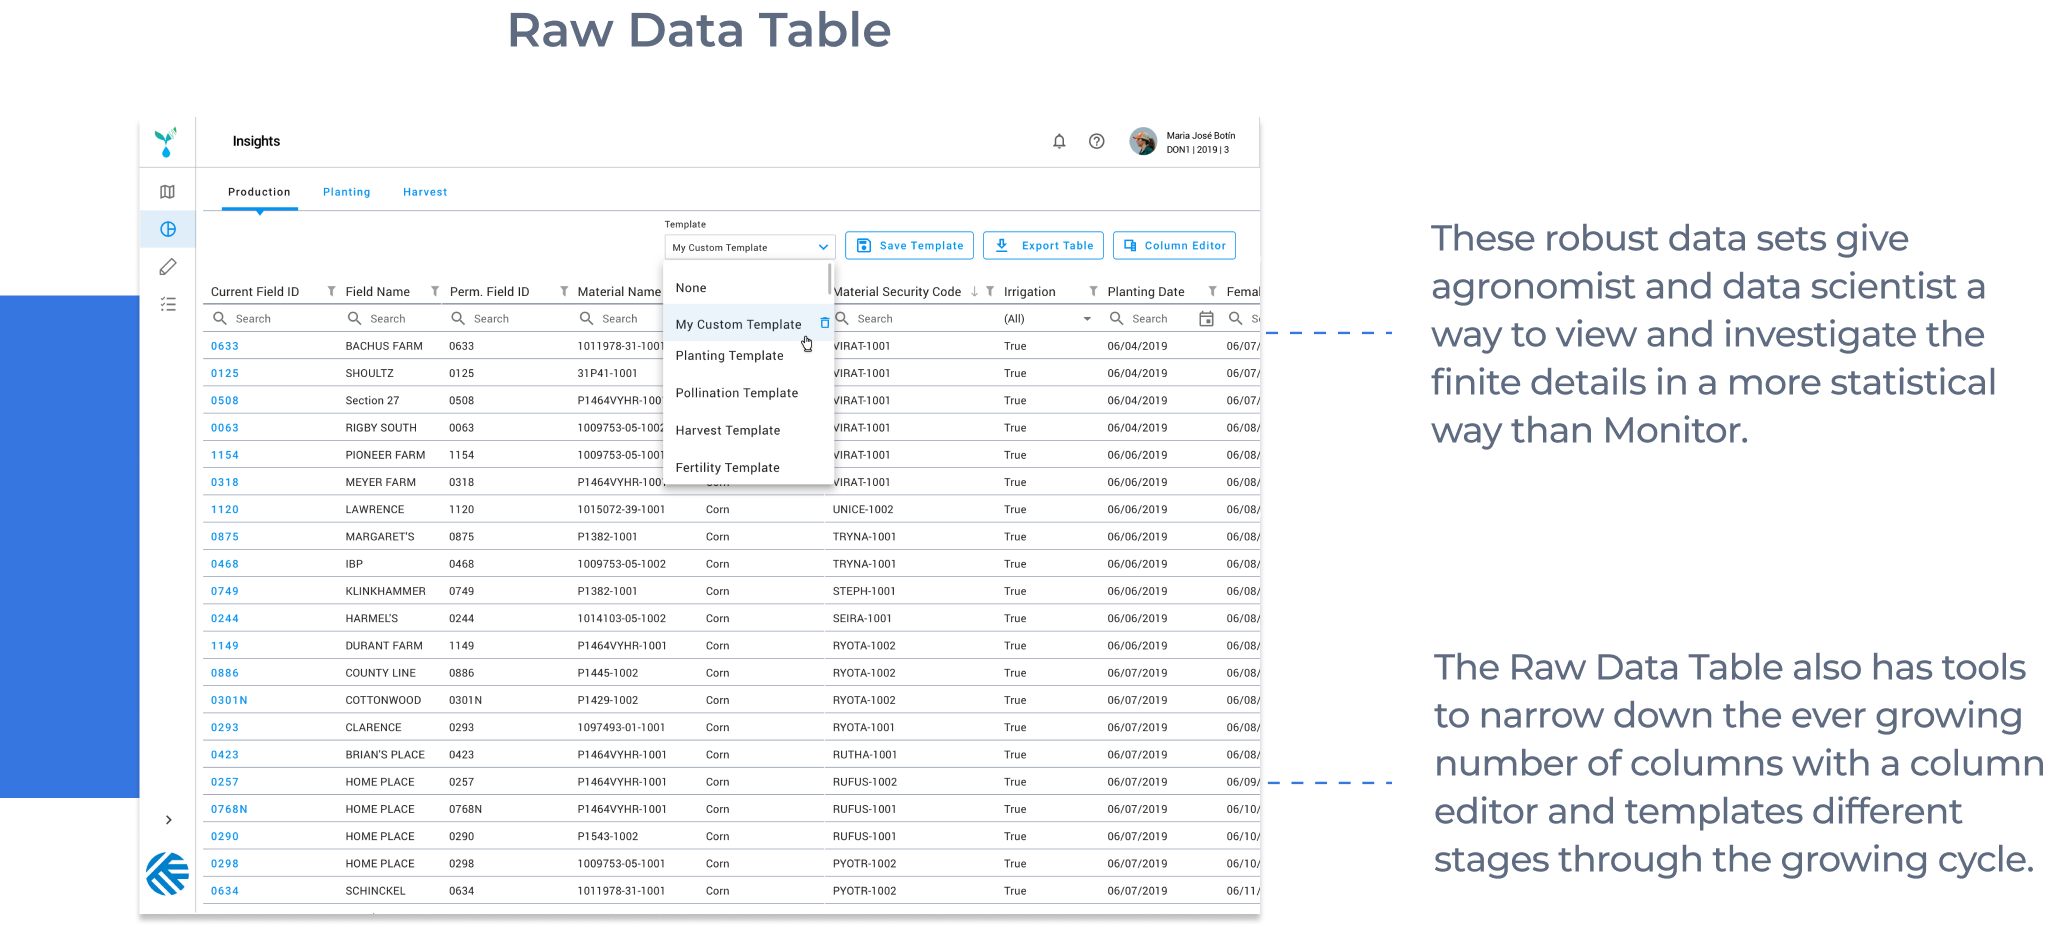
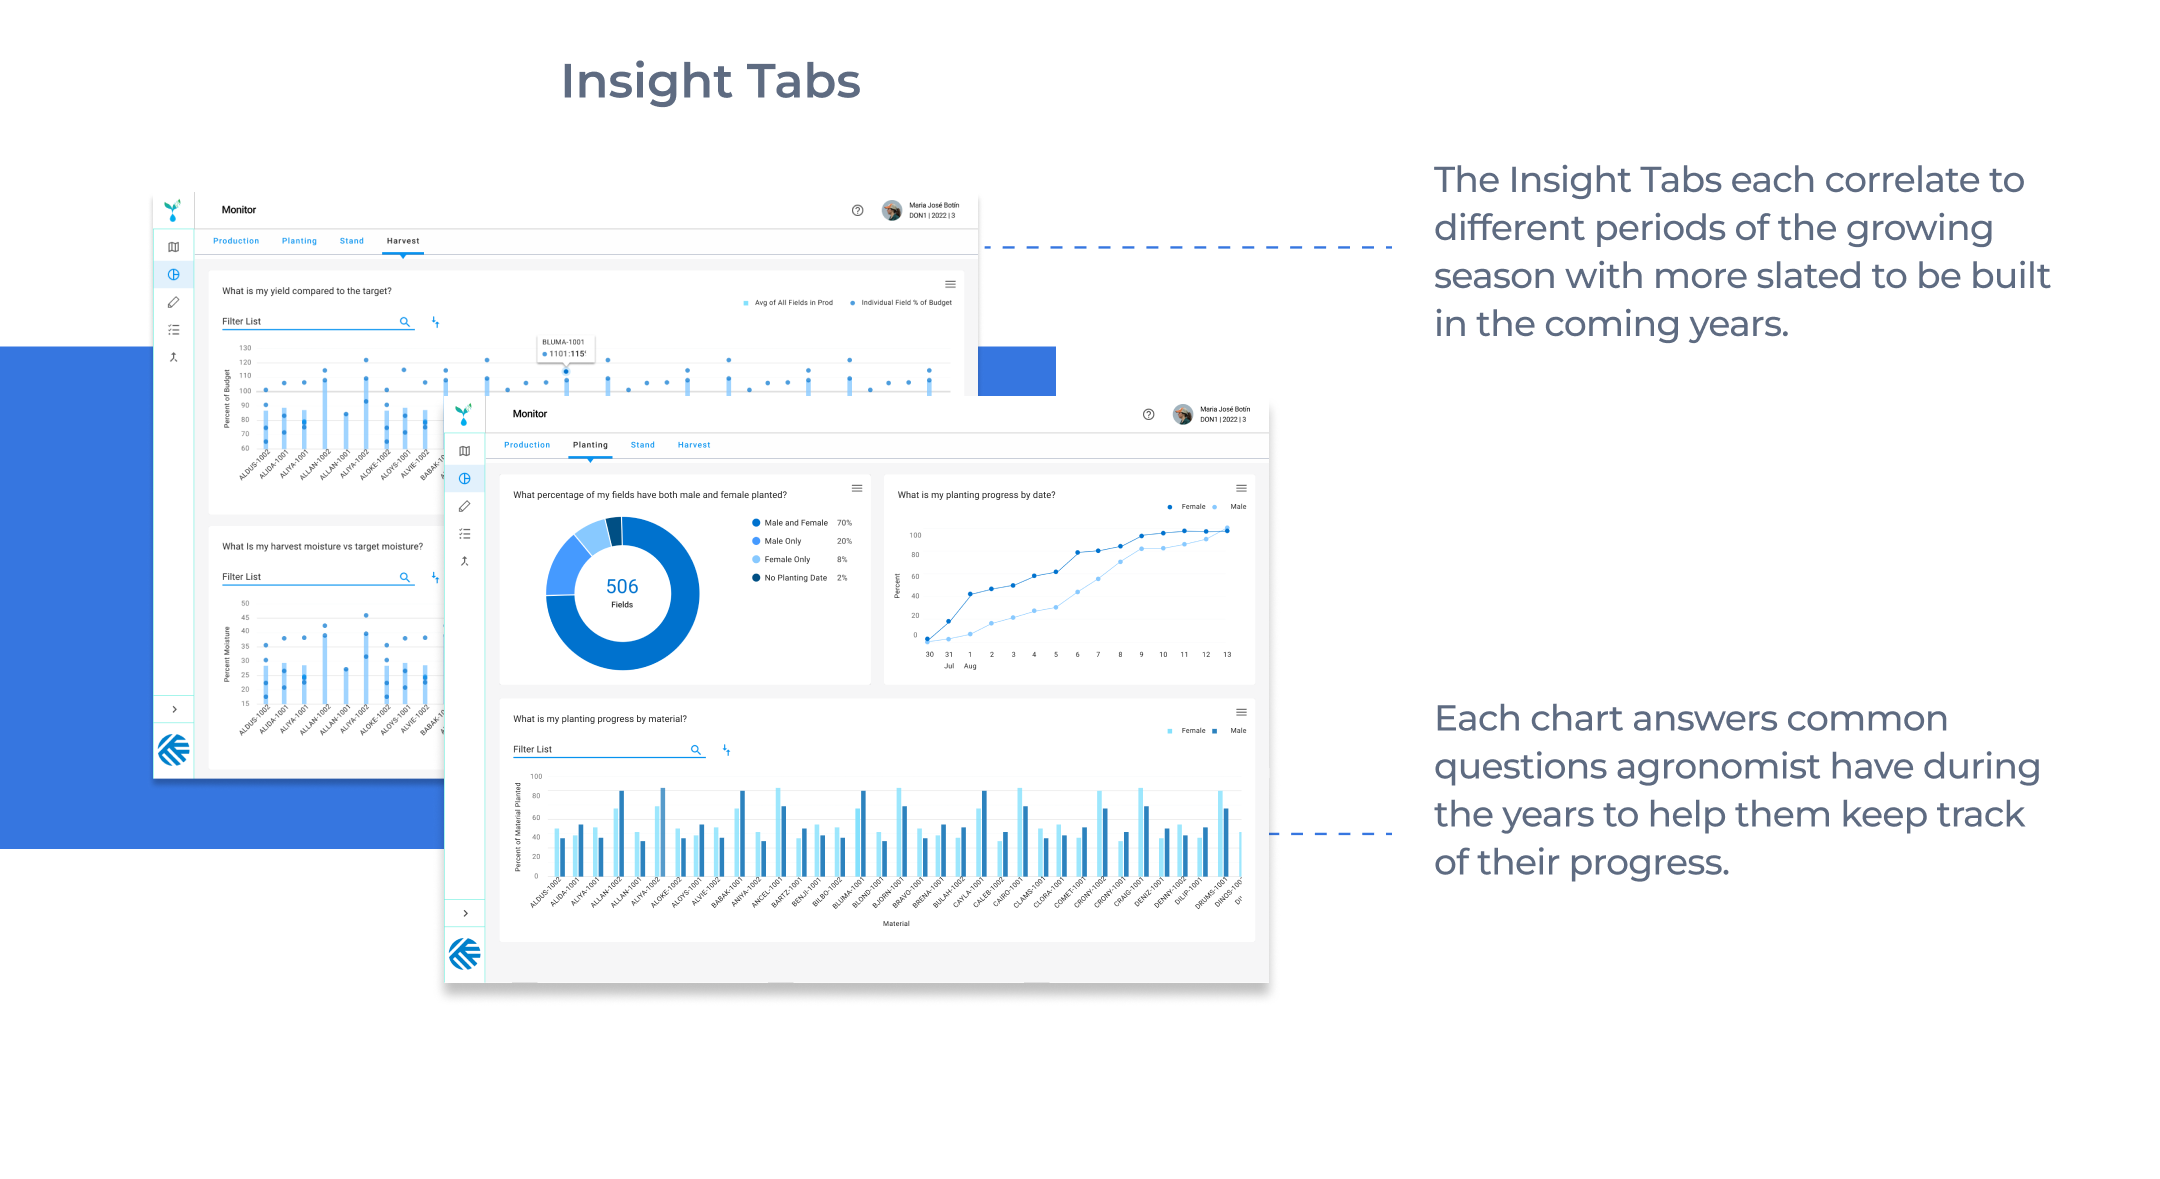
Insights
The Insights page is a raw data table and dashboard view of all the information available for a single production location, also referred to as a plant.
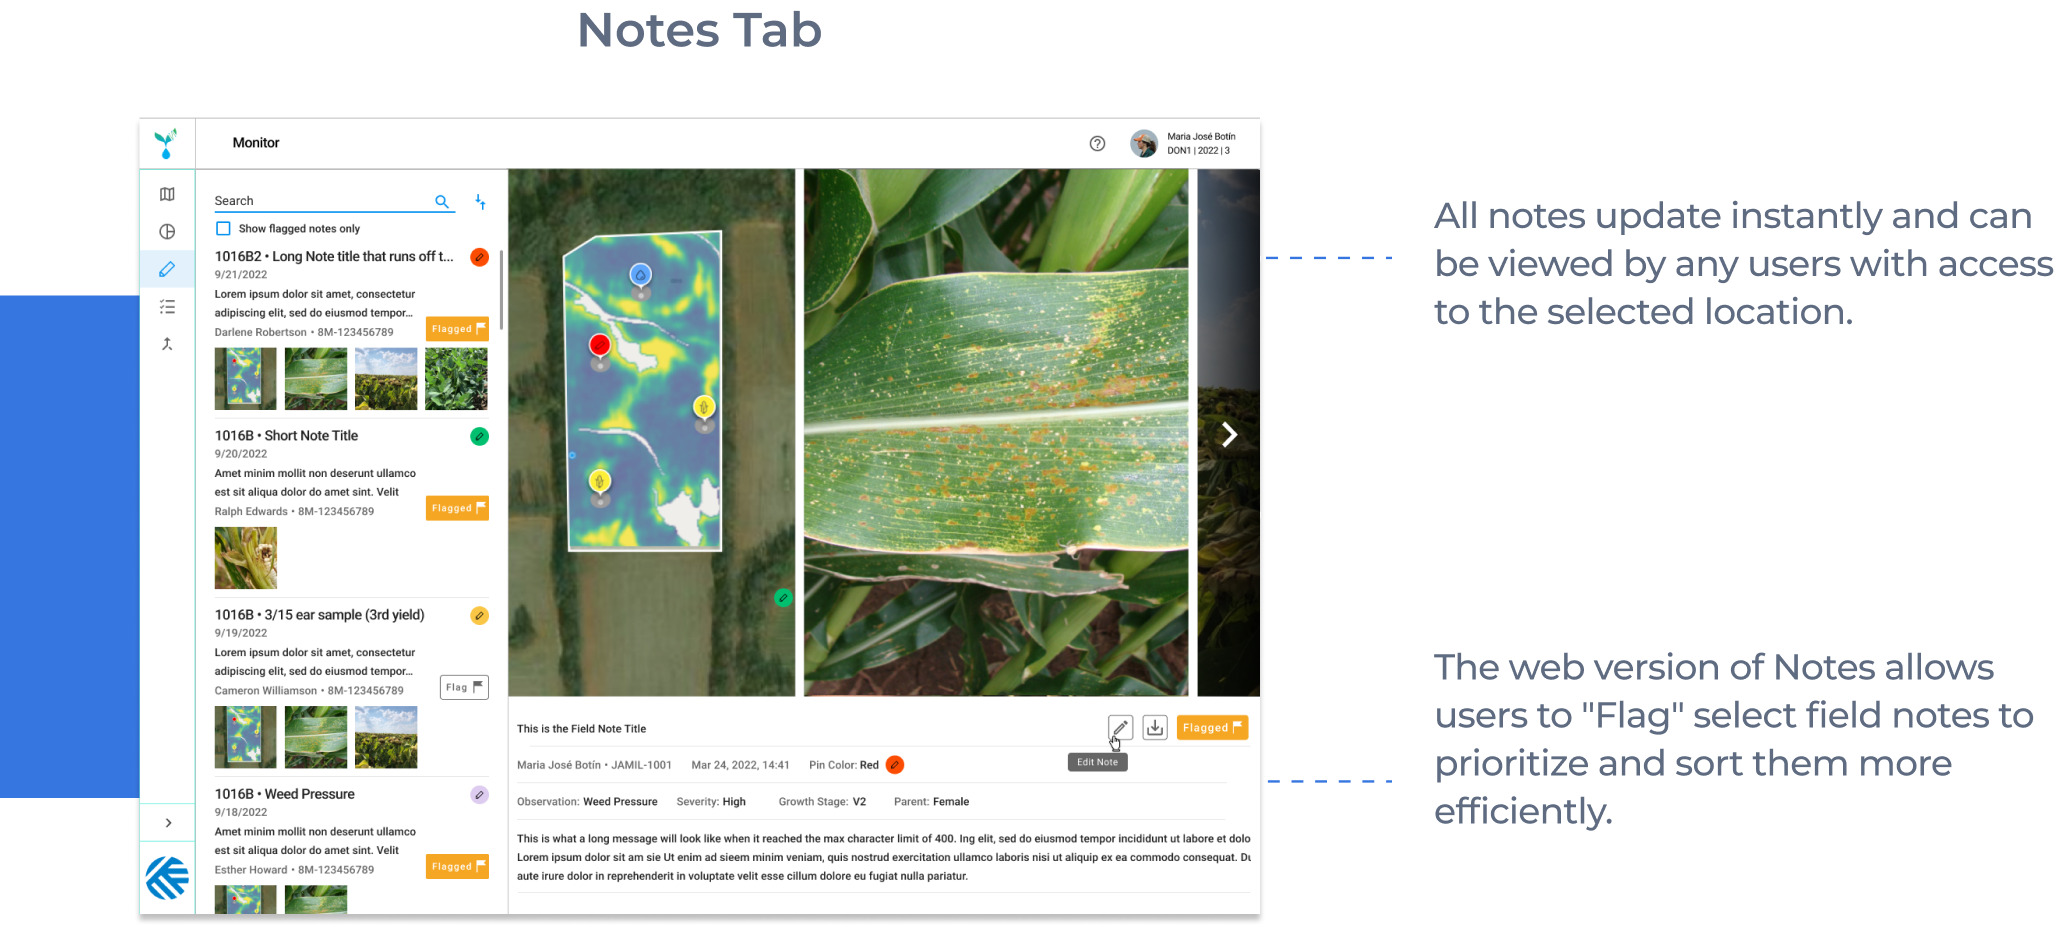
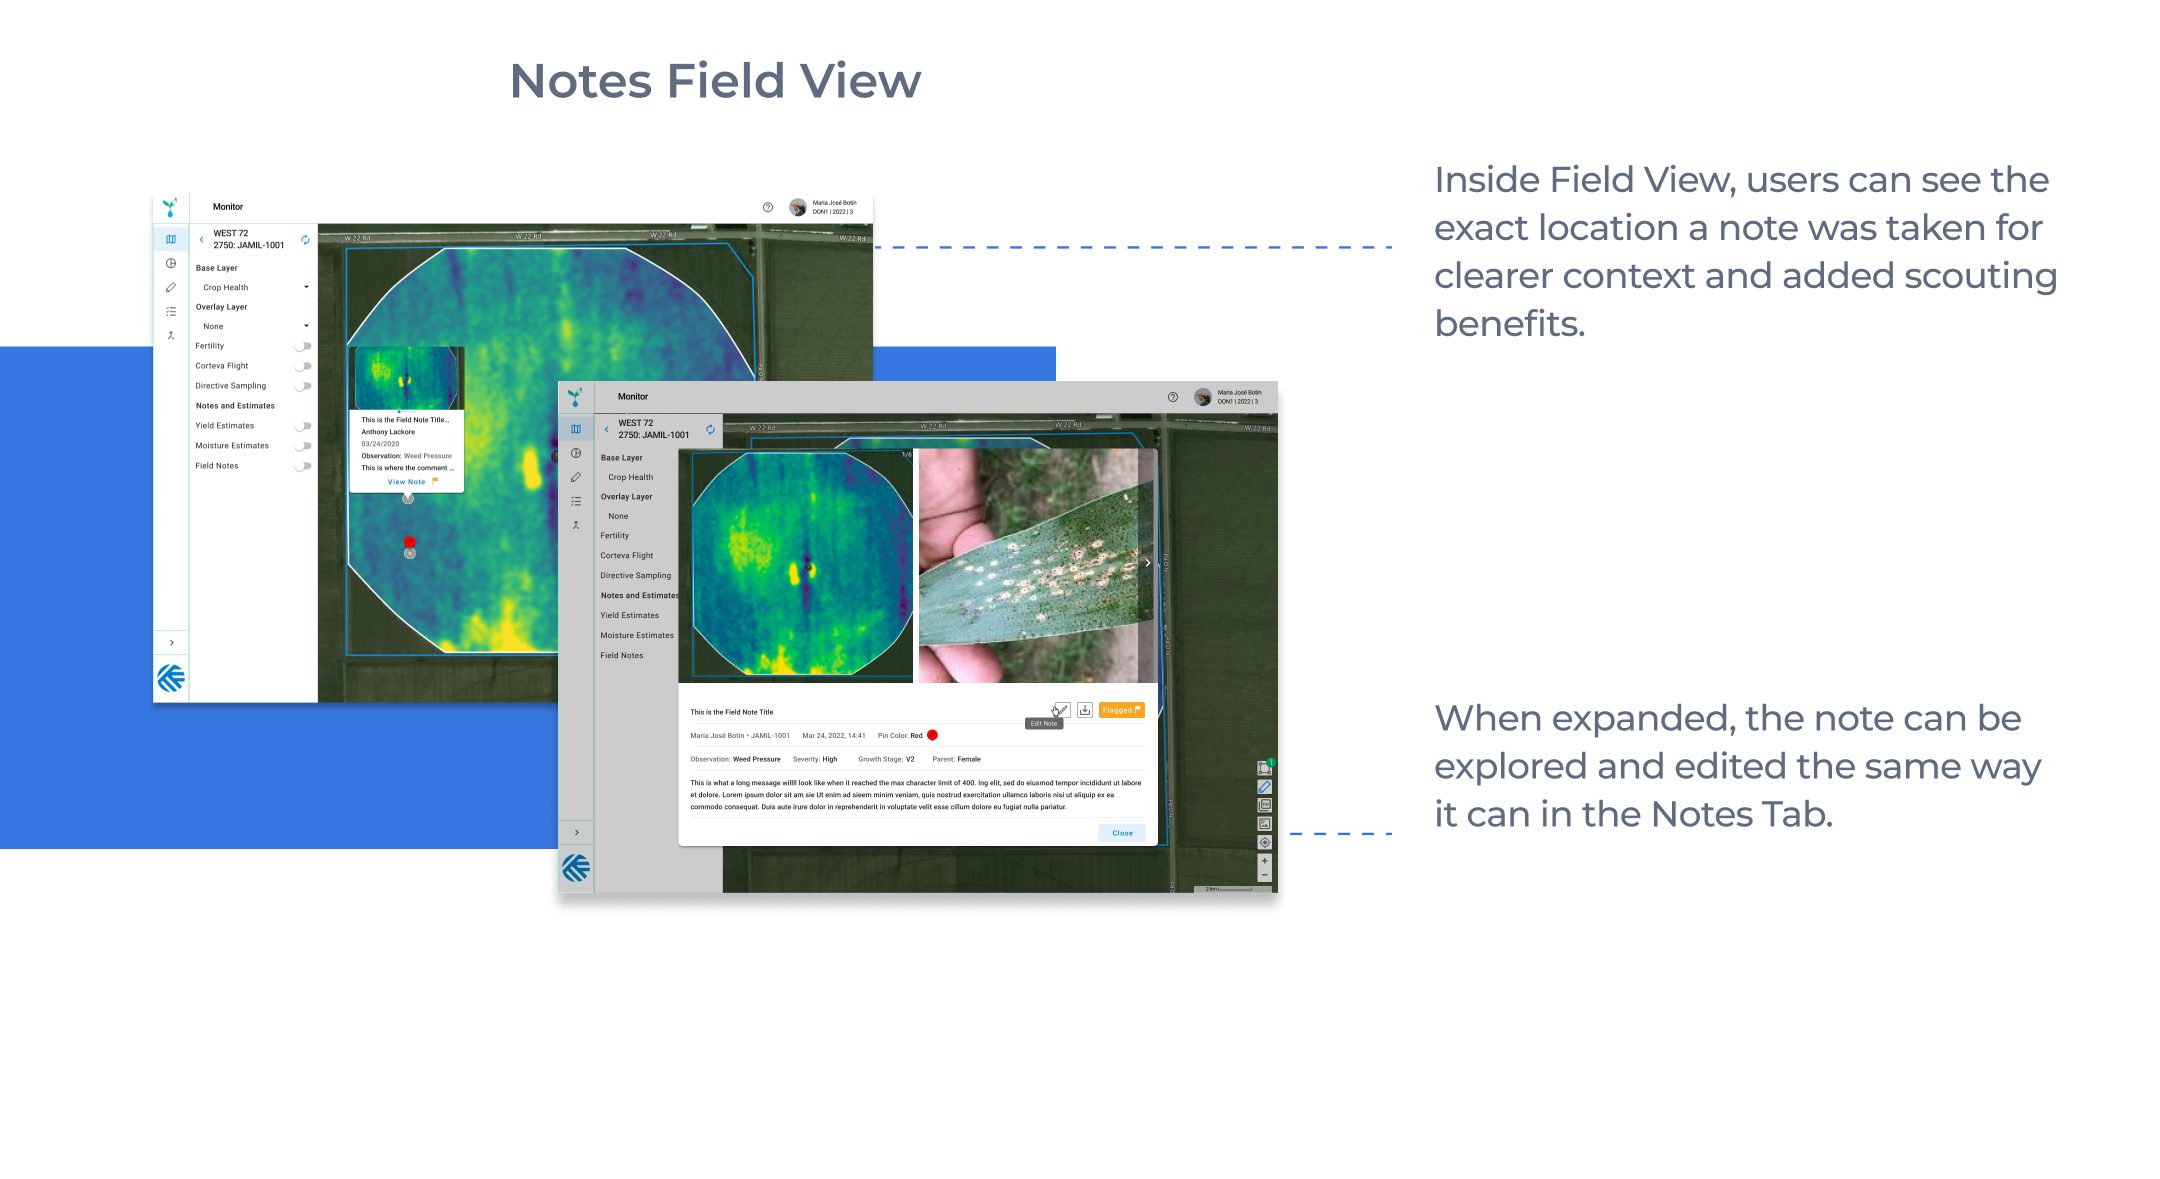
Field Notes
Field Notes enable agronomists and field scouts with the ability to quickly capture, share, and view notes and photos throughout the growing season. In addition to sharing with teams, notes can be sent directly to seed growers and crop consultants.
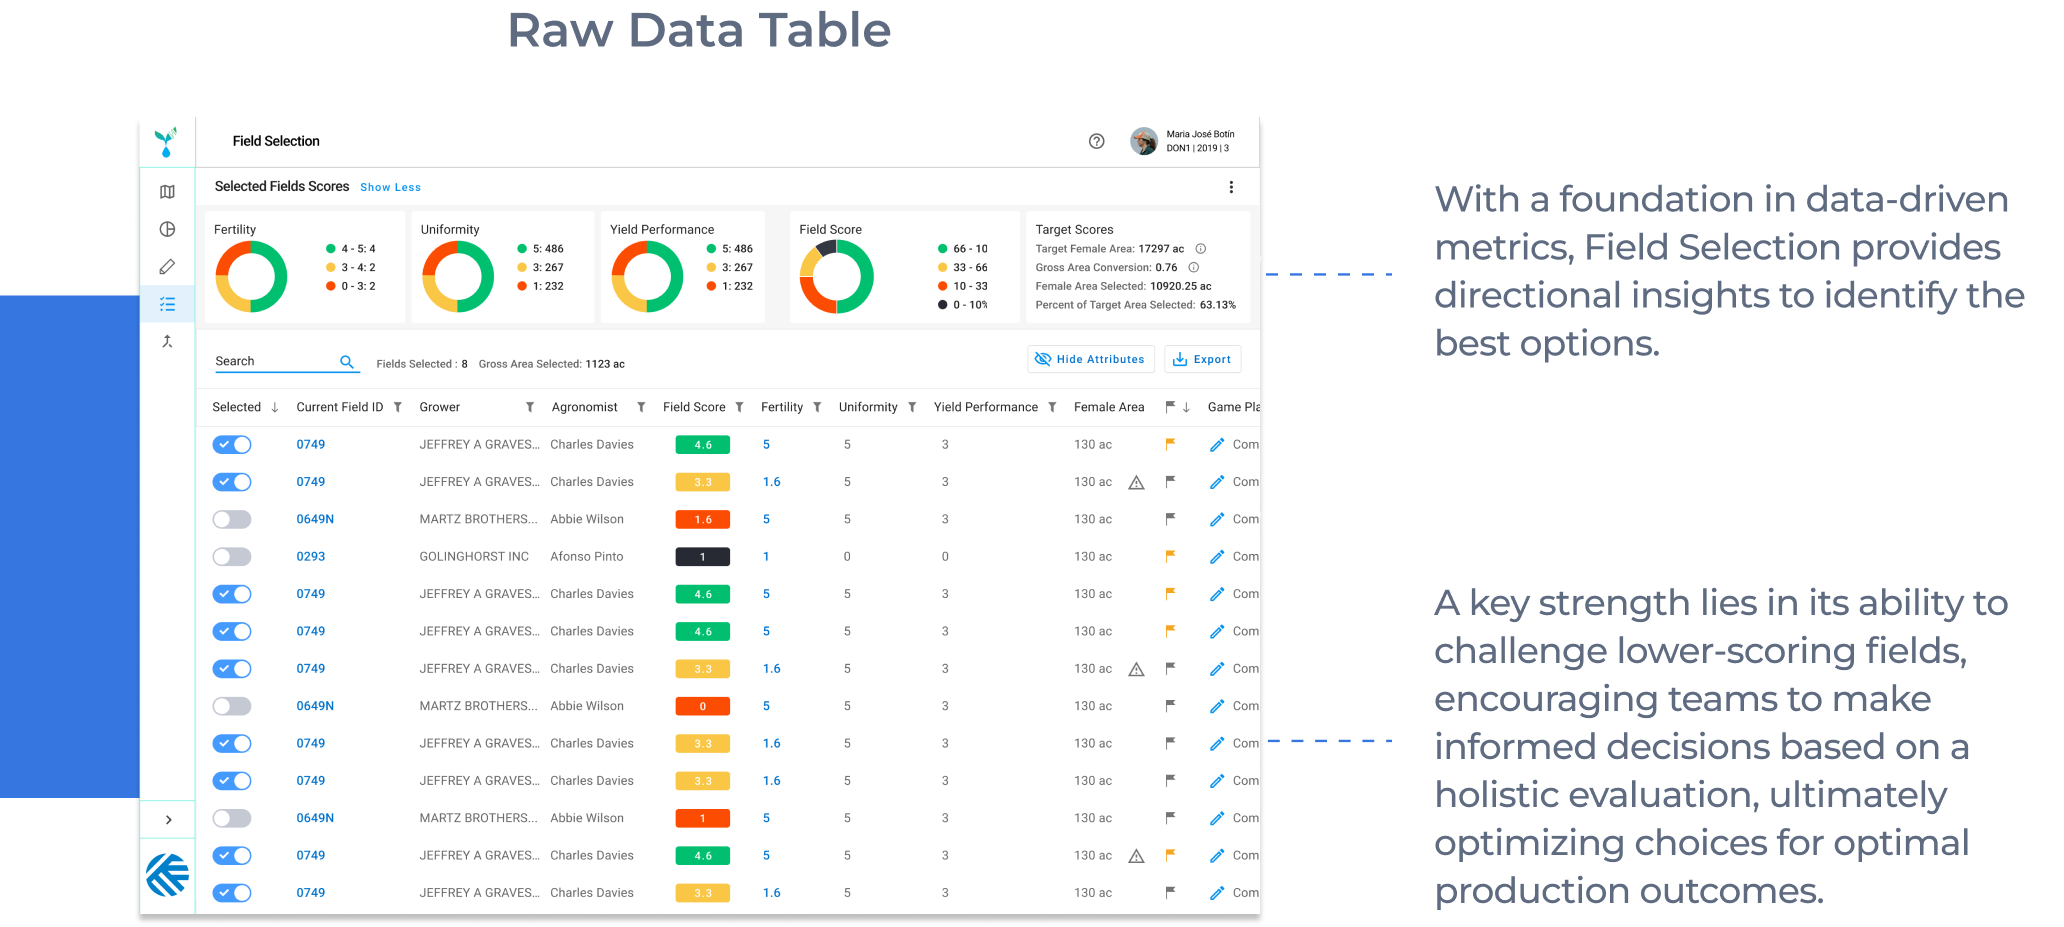
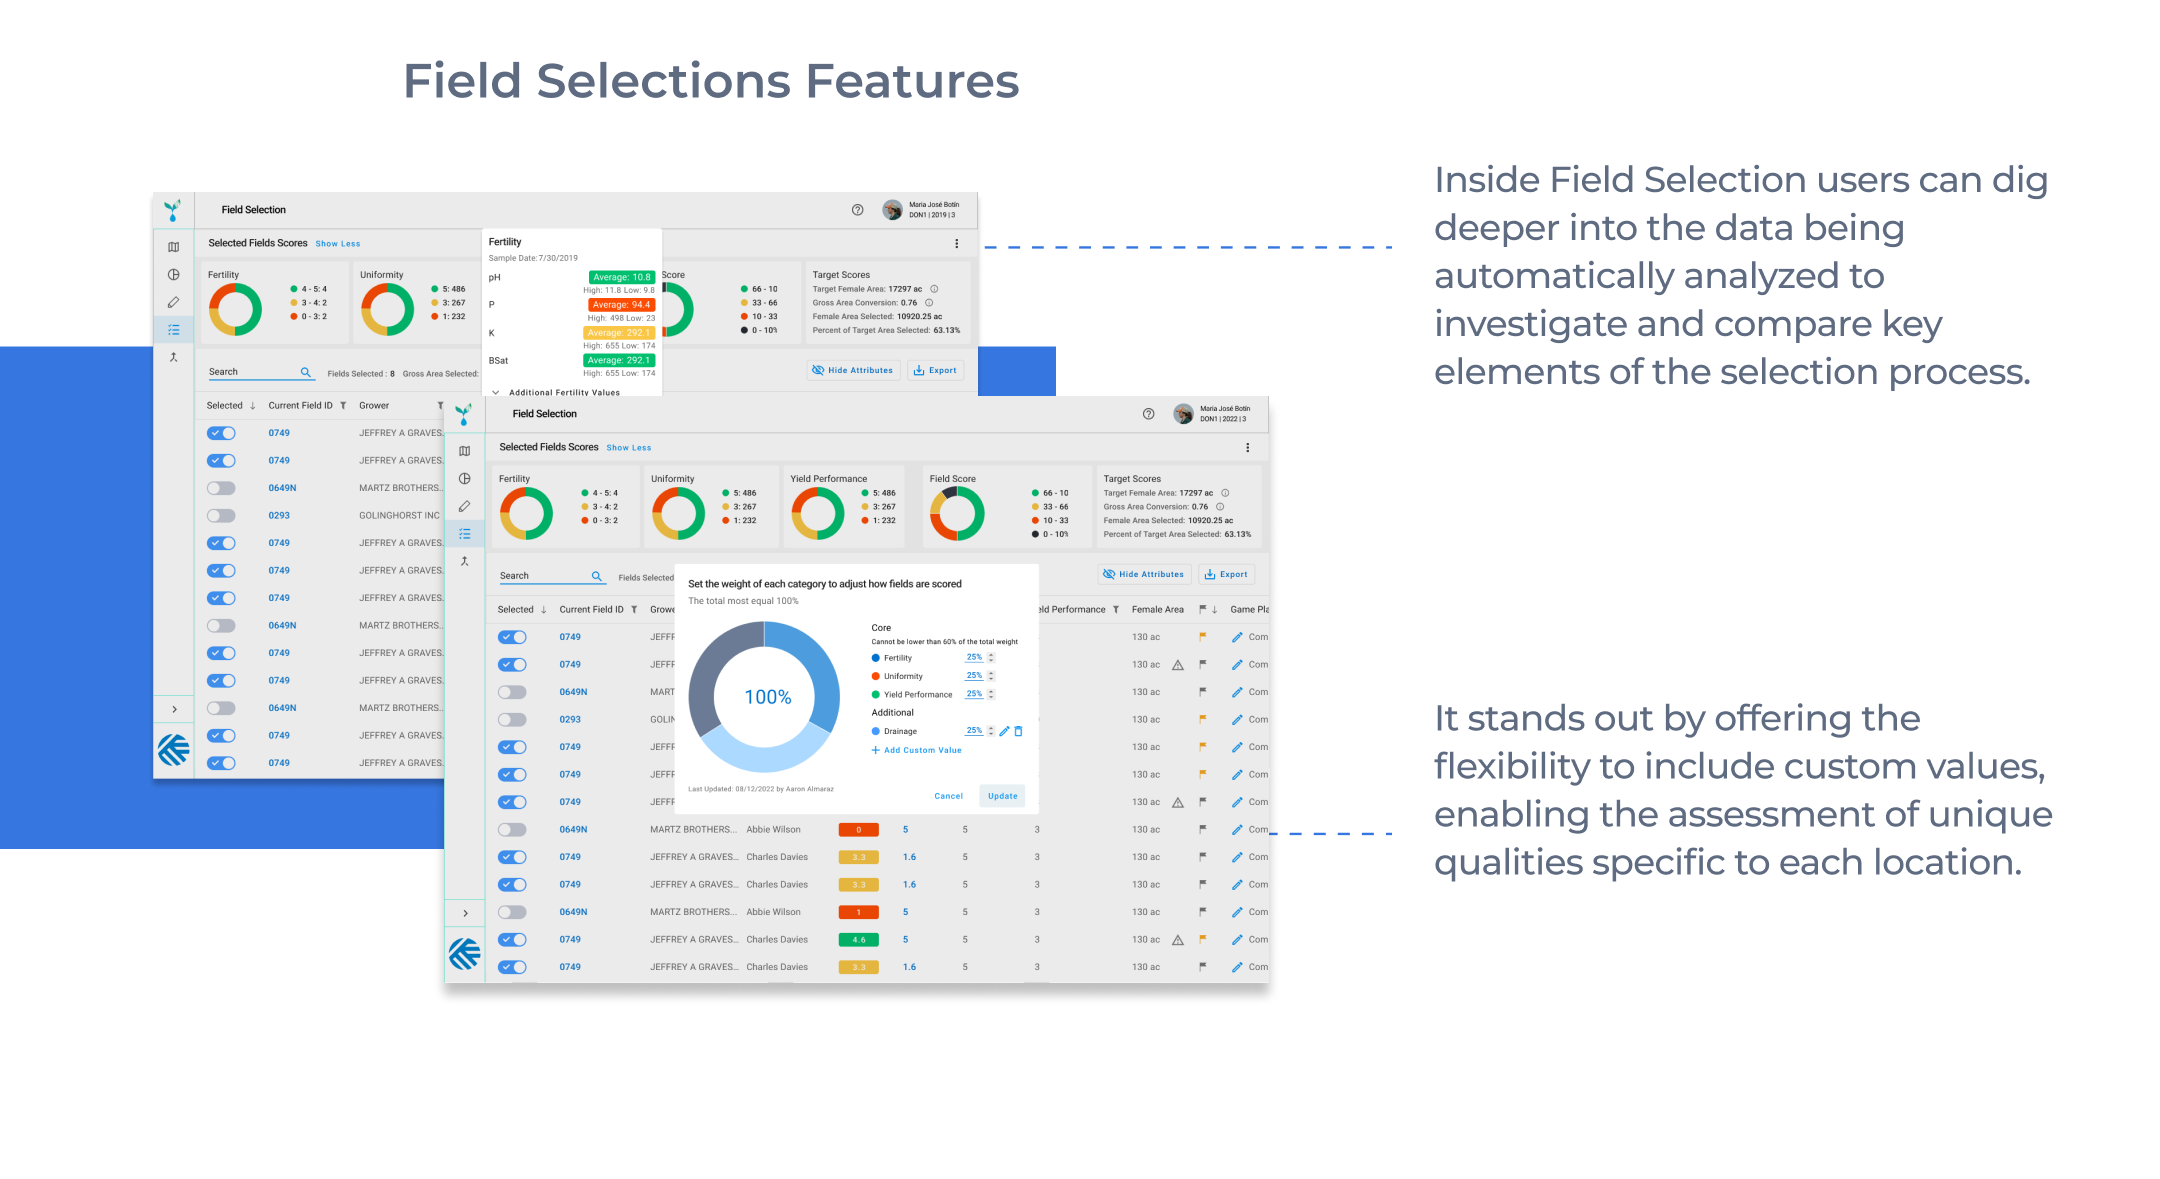
Field Selection
Field Selection is a versatile tool designed to empower teams in setting up for success by facilitating a thorough evaluation of all available fields. Beyond assessing typical fields, the tool accommodates prospects, allowing for a comprehensive analysis.
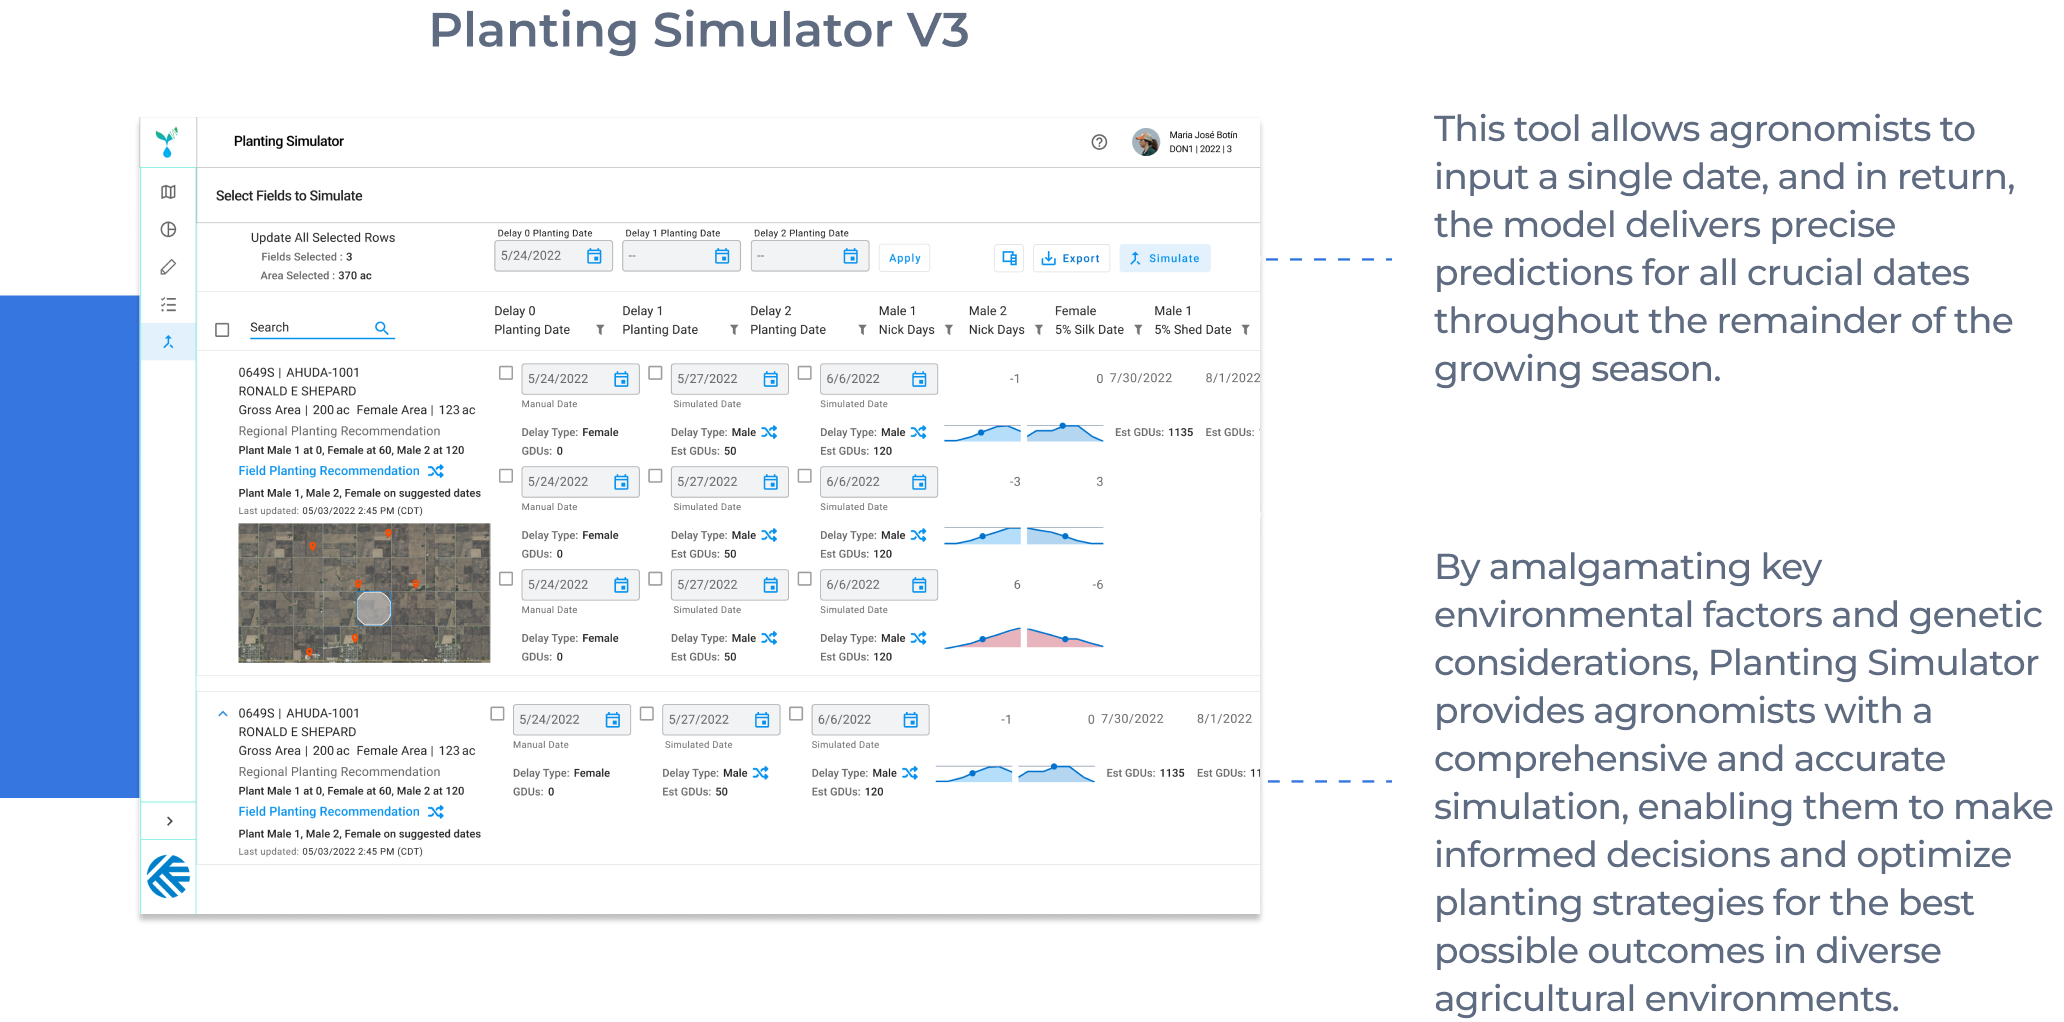
Planting Simulator
Planting Simulator is a cutting-edge tool designed to empower agronomists by integrating local current and forecast weather data, alongside specific soil information, and genetic responses tailored to Female/Male plant variations.
Key Takeaways
The implementation of Blueprint yielded significant results for Corteva. The tool successfully optimized production capacity and maximized yields by providing accurate and actionable insights. Agronomists and growers experienced enhanced accuracy in production estimates, contributing to the creation of robust predictive yield models. The streamlined data flow to other applications in the Corteva ecosystem improved overall process efficiency. Blueprint emerged as a transformative solution, solidifying its place as a cornerstone in Corteva’s global seed production strategy.
Key Players
If you enjoyed this case study and would like to learn more about some of the talented UXers that made it possible, please consider connecting with them on LinkedIn.