 Skip to content
 Insights
Putting Information Behind Intuition
Transforming Field Data into
Actionable Intelligence
Duration:
2019 – 2024
Product Overview
Insights, a feature embedded within Blueprint Web, transcends conventional agronomy tools by providing agronomists, field operations managers, data scientists, and regional managers with direct access to raw data from every corner of the digital fields product line.
Going beyond typical data visualizations, Insights offers a large spreadsheet for users to download raw data, coupled with moment-of-need charts and graphs designed to address common questions throughout the growing season.
The primary goal is to empower agronomists with real-time, field-level granularity, enhancing their ability to make informed decisions influencing yield and quality.
Responsibility
- Sole designer and researcher.
- Worked across two fully staffed teams of as a cross-functional designer.
- Managed stakeholder meetings and led the strategy for implementation.
Geographies
- North America
- Latin America
- Europe
- Asia Pacific
- South Africa
Problem Statement
“How might we provide agronomists and field operations managers with a streamlined and intuitive solution within Blueprint that allows them to seamlessly navigate and extract valuable, customized data from a vast array of sources, ensuring efficient decision-making during the growing season?”
Target Audience
- Agronomists: Optimize crop management decisions.
- Field Scouts: Capture and share real-time field data.
- Seed Growers: Receive advanced data insights about their fields.
- Crop Consultants: Access valuable crop information.
- Date Scientist : Drive data-driven decision-making.
The Challenge
Insights aimed to address the complexity of field data by offering users a platform to view and download raw spreadsheet data for more in-depth analysis.
Key challenges included breaking down crucial elements of the growing season, adapting the interface to varying user needs, and integrating diverse data from proprietary and external sources.
With hundreds of data point from internal and external sources such as farm equipment, observations, samples, and a lot more, presenting this information visually in a meaningful way was a significant challenge.

Research Methods
To address these challenges, a combination of user interviews with stakeholders across applicable roles of agronomy, on-site visits for firsthand observations of user, A/B testing of prototypes, and beta testing with select user groups were employed. These methods allowed for a holistic understanding of user needs and challenges in different agronomic settings.
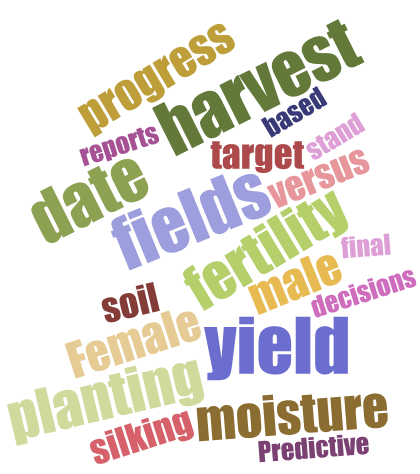
Common Themes Uncovered
Users provided their most common questions throughout the growing season, guiding UX research in identify crucial user needs. This collaborative approach ensured the tool’s design aligned closely with practical challenges, prioritizing features that directly addressed recurring concerns. The aim was to enhance usability and effectiveness, delivering an intuitive and valuable experience throughout the entire growing season.
1. Optimizing Planting Decisions:
When taking notes and making observations, users need to be able to follow a process flow that optimizes their time and automatically formats data in an actionable way.
2. Ensuring Soil Fertility
Questions related to soil fertility, such as insufficient fertility, missing soil fertility, and qualification for fertility incentives, underscore a major concern about maintaining and enhancing soil health.
3. Effective Harvest Management
The questions related to harvest progress, yield, moisture, loss, and dry down status highlight concerns about efficient harvest management.


Competitive Analysis
Insights offers a competitive edge by providing a comprehensive platform that seamlessly integrates field data from diverse sources. Unlike competitors, it enables users to customize the data they view, empowering agronomists with deeper insights. The easy export feature and deep linking capabilities set Insights apart, fostering a user-friendly experience. Additionally, the platform’s integration of various data visualization tools outshines competitors, creating a unique solution for efficient agricultural decision-making.

Information Architecture and Unique Features

1. User-Centric Design
Insights features an information architecture tailored to user needs, facilitating easy navigation through diverse agricultural data.
2. Comprehensive Data Display
Slow or nonexistent service in rural areas poses significant challenges to operations.
3. Interactive Data Visualizations
The inclusion of interactive data visualization charts allows users to drill down into more detailed raw data, enhancing their ability to analyze and interpret information.
4. Custom Templates
The template feature enhances user customization, allowing for personalized views and streamlined workflows within the Insights platform.
5. Deep Linking to Each Field
The template feature enhances user customization, allowing for personalized views and streamlined workflows within the Insights platform.
The User Experience and Flow of Insights
The user experience of Blueprint Insights is meticulously crafted to guide users seamlessly from a high-level overview, offering a comprehensive view of field activities, down to the microscopic details of their field data. This journey is designed to mimic the user’s natural workflow, starting with a broad understanding and progressively delving into more granular insights. This intuitive approach ensures users can effortlessly navigate through various layers of information, facilitating informed decision-making by transitioning from the ten-thousand-foot view to the microscopic intricacies of their agricultural data.
Dashboards
Quick summary with mouse hovering, and written context of data.
Drill Down
Ability to select specific areas of charts and display the data associated to that portion.
Dig Deeper
Raw data ready to export for more advanced investigations.
Insights for Every Occasion
Easy tab navigation for each part of the growing season.
Everything Blueprint displays throughout the app in its purest form for deeper analysis.
Narrow down the raw data columns with prebuilt templates from your feedback or create your own.
Search and filter multiple columns for broader criteria that yields more insights.
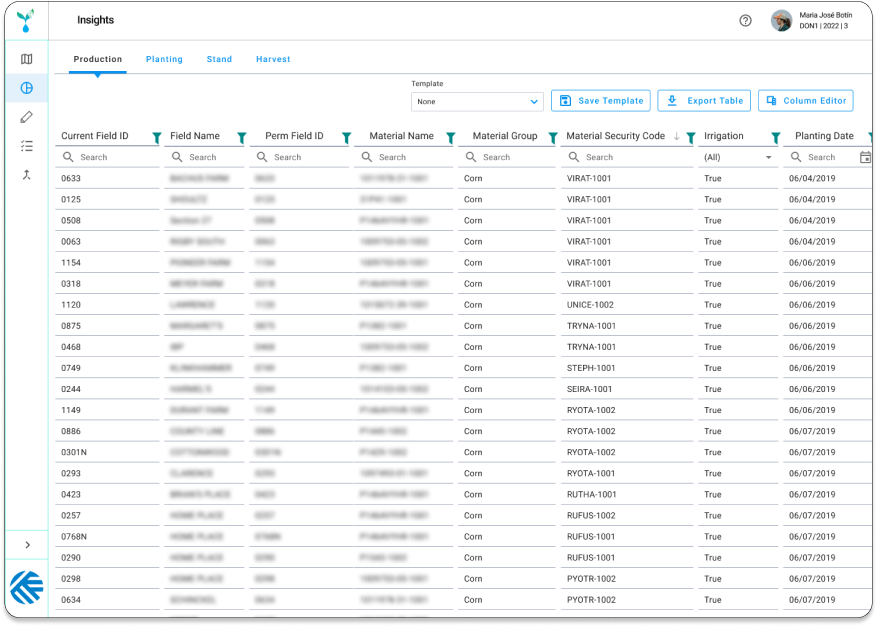
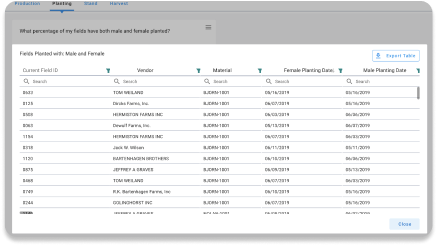
Production Tab Raw-Data Table
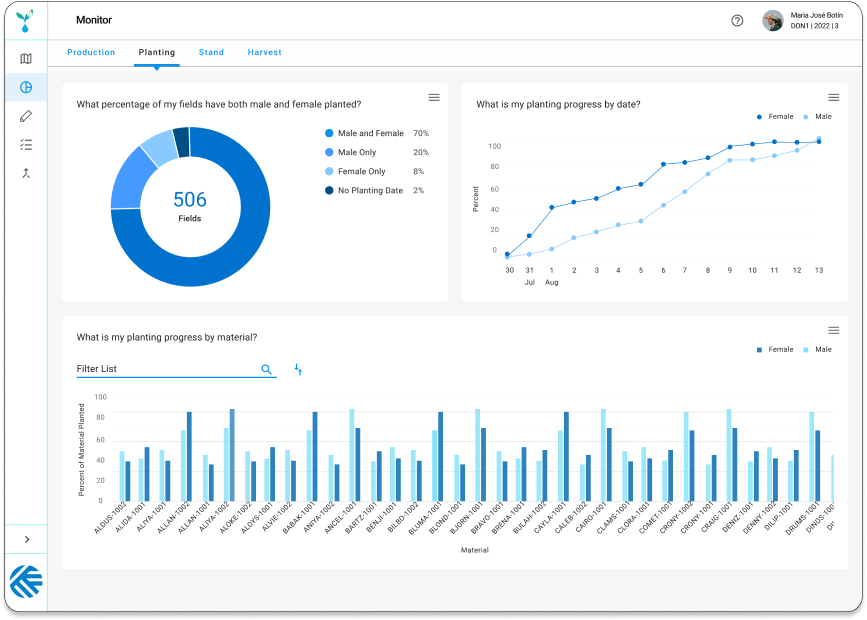
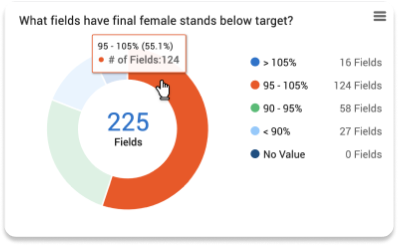
Planting Tab High-Level View
Your most common questions answered visually.
Research backed data visualizations that have the highest value to users.
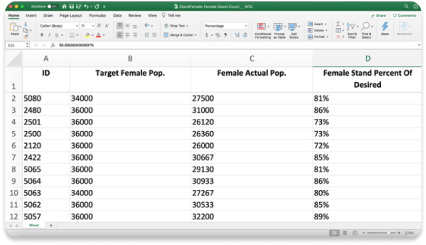
Export the data sets to Excel or send an image of the chart to help others see the big picture.
Searchable charts for robust data sets that help you target specific criteria within a hypothesis.
Expand specific data sets within each chart for deeper analysis.
Narrow down large scale data with advanced sort and search options.
Export the data straight to Excel to add to your persona database.
Navigate directly to a field map by clicking on a deep-linked Field ID.
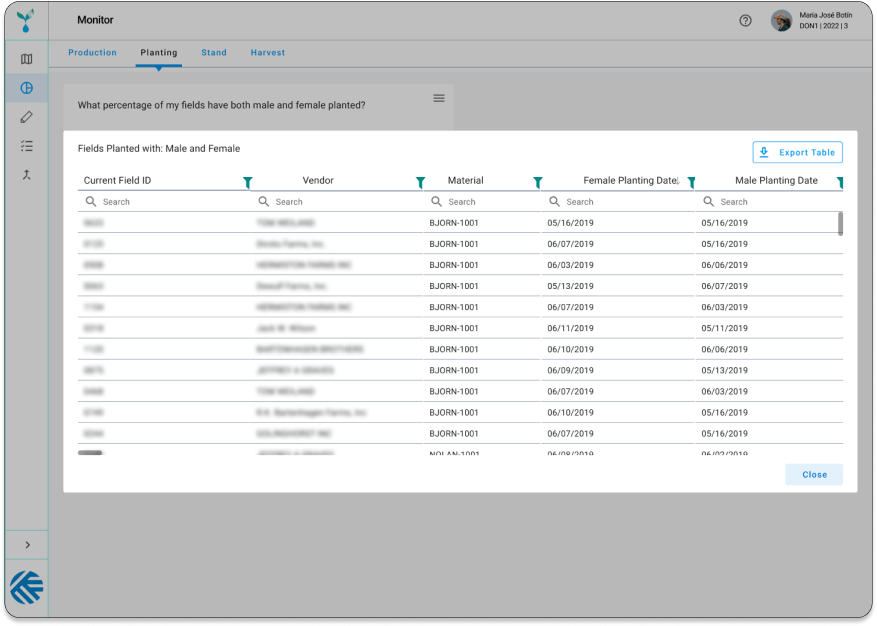
Insights Chart Drill-Down Table
Results
Insights achieved a high adoption rate, indicating its value to users. The app significantly reduced time frames, contributing to a more efficient workforce. The project also led to advancements in internal technologies, improved accuracy of scientific data, and a notable year-over-year increase in production capacity and yields. The success of Insights marks a crucial step in enhancing the overall efficiency and effectiveness of agronomic processes.
